21/03/2007
Round Trip and Packet Loss stats with rrdtool
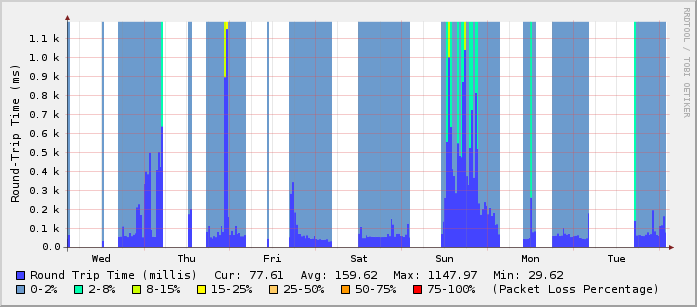
To get some nice graphs showing your round trip time and your packet loss, like the following image, follow the steps below:

What you need before you start: rrdtool and a cron server (vixie-cron is fine).
a) Execute the following
/usr/bin/rrdtool create /var/rrds/ping/ping_wan.rrd \

    --step 300 \

    DS:pl:GAUGE:600:0:100 \

    DS:rtt:GAUGE:600:0:10000000 \

    RRA:AVERAGE:0.5:1:800 \

    RRA:AVERAGE:0.5:6:800 \

    RRA:AVERAGE:0.5:24:800 \

    RRA:AVERAGE:0.5:288:800 \

    RRA:MAX:0.5:1:800 \

    RRA:MAX:0.5:6:800 \

    RRA:MAX:0.5:24:800 \

    RRA:MAX:0.5:288:800
You can change /var/rrds/ping/ping_wan.rrd to the path/file.rrd you wish.
b) Save the following to the file ping.sh
#!/bin/bash

PING=/bin/ping

COUNT=4

DEADLINE=10

ping_host() {

    local output=$($PING -q -n -c $COUNT -w $DEADLINE $1 2>&1)

    # notice $output is quoted to preserve newlines

    local temp=$(echo "$output"| awk '

        BEGIN           {pl=100; rtt=0.1}

        /packets transmitted/   {

            match($0, /([0-9]+)% packet loss/, matchstr)

            pl=matchstr[1]

        }

        /^rtt/          {

            # looking for something like 0.562/0.566/0.571/0.024

            match($4, /(.*)\/(.*)\/(.*)\/(.*)/, a)

            rtt=a[2]

        }

        /unknown host/  {

            # no output at all means network is probably down

            pl=100

            rtt=0.1

        }

        END             {print pl ":" rtt}

        ')

    RETURN_VALUE=$temp

}

# ping a host on the local lan

ping_host www.ntua.gr

/usr/bin/rrdtool update \

    /var/rrds/ping/ping_wan.rrd \

    --template \

    pl:rtt \

    N:$RETURN_VALUE
ping.sh.gz
Change the ping_host www.ntua.gr to the one of your choice. Make the script executable, chmod +x ping.sh.
If you have changed the /var/rrds/ping/ping_wan.rrd on step (a) you have to change it here too.
c) Save the following to ping-graph.sh and make it executable.
#!/bin/sh

cd /var/rrds/ping/

echo "

<HTML>

<HEAD><TITLE>Round-Trip and Packet Loss Stats</TITLE></HEAD>

        <BODY>

        <H3>Hourly Round-Trip & Packetloss Stats(1min average)</H3>

" > index.html

rrdtool graph ping_wan_hour.png -h 225 -w 600  -a PNG \

    --imginfo '<IMG SRC=/stats/%s WIDTH=%lu HEIGHT=%lu >' \

    --start -3600 --end -60 --x-grid MINUTE:10:HOUR:1:MINUTE:30:0:%R \

    -v "Round-Trip Time (ms)" \

    --rigid \

    --lower-limit 0 \

    DEF:roundtrip=ping_wan.rrd:rtt:AVERAGE \

    DEF:packetloss=ping_wan.rrd:pl:AVERAGE \

    CDEF:PLNone=packetloss,0,2,LIMIT,UN,UNKN,INF,IF \

    CDEF:PL2=packetloss,2,8,LIMIT,UN,UNKN,INF,IF \

    CDEF:PL15=packetloss,8,15,LIMIT,UN,UNKN,INF,IF \

    CDEF:PL25=packetloss,15,25,LIMIT,UN,UNKN,INF,IF \

    CDEF:PL50=packetloss,25,50,LIMIT,UN,UNKN,INF,IF \

    CDEF:PL75=packetloss,50,75,LIMIT,UN,UNKN,INF,IF \

    CDEF:PL100=packetloss,75,100,LIMIT,UN,UNKN,INF,IF \

    AREA:roundtrip#4444ff:"Round Trip Time (millis)" \

    GPRINT:roundtrip:LAST:"Cur\: %5.2lf" \

    GPRINT:roundtrip:AVERAGE:"Avg\: %5.2lf" \

    GPRINT:roundtrip:MAX:"Max\: %5.2lf" \

    GPRINT:roundtrip:MIN:"Min\: %5.2lf\n" \

    AREA:PLNone#6c9bcd:"0-2%":STACK \

    AREA:PL2#00ffae:"2-8%":STACK \

    AREA:PL15#ccff00:"8-15%":STACK \

    AREA:PL25#ffff00:"15-25%":STACK \

    AREA:PL50#ffcc66:"25-50%":STACK \

    AREA:PL75#ff9900:"50-75%":STACK \

    AREA:PL100#ff0000:"75-100%":STACK \

    COMMENT:"(Packet Loss Percentage)"

echo "

<img src="ping_wan_hour.png"><br>

<br>

<H3>Daily Round-Trip & Packetloss Stats(1min average)</H3>

" >> index.html

rrdtool graph ping_wan_day.png -h 225 -w 600  -a PNG \

    --imginfo '<IMG SRC=/stats/%s WIDTH=%lu HEIGHT=%lu >' \

    --lazy --start -86400 --end -60 --x-grid MINUTE:30:HOUR:1:HOUR:2:0:%H \

    -v "Round-Trip Time (ms)" \

    --rigid \

    --lower-limit 0 \

    DEF:roundtrip=ping_wan.rrd:rtt:AVERAGE \

    DEF:packetloss=ping_wan.rrd:pl:AVERAGE \

    CDEF:PLNone=packetloss,0,2,LIMIT,UN,UNKN,INF,IF \

    CDEF:PL2=packetloss,2,8,LIMIT,UN,UNKN,INF,IF \

    CDEF:PL15=packetloss,8,15,LIMIT,UN,UNKN,INF,IF \

    CDEF:PL25=packetloss,15,25,LIMIT,UN,UNKN,INF,IF \

    CDEF:PL50=packetloss,25,50,LIMIT,UN,UNKN,INF,IF \

    CDEF:PL75=packetloss,50,75,LIMIT,UN,UNKN,INF,IF \

    CDEF:PL100=packetloss,75,100,LIMIT,UN,UNKN,INF,IF \

    AREA:roundtrip#4444ff:"Round Trip Time (millis)" \

    GPRINT:roundtrip:LAST:"Cur\: %5.2lf" \

    GPRINT:roundtrip:AVERAGE:"Avg\: %5.2lf" \

    GPRINT:roundtrip:MAX:"Max\: %5.2lf" \

    GPRINT:roundtrip:MIN:"Min\: %5.2lf\n" \

    AREA:PLNone#6c9bcd:"0-2%":STACK \

    AREA:PL2#00ffae:"2-8%":STACK \

    AREA:PL15#ccff00:"8-15%":STACK \

    AREA:PL25#ffff00:"15-25%":STACK \

    AREA:PL50#ffcc66:"25-50%":STACK \

    AREA:PL75#ff9900:"50-75%":STACK \

    AREA:PL100#ff0000:"75-100%":STACK \

    COMMENT:"(Packet Loss Percentage)"

echo "

<img src="ping_wan_day.png"><br>

<br>

<H3>Weekly Round-Trip & Packetloss Stats(1min average)</H3>

" >> index.html

rrdtool graph ping_wan_week.png -h 225 -w 600 -a PNG \

    --imginfo '<IMG SRC=/stats/%s WIDTH=%lu HEIGHT=%lu >' \

    --lazy --start -604800 --end -1800 \

    -v "Round-Trip Time (ms)" \

    --rigid \

    --lower-limit 0 \

    DEF:roundtrip=ping_wan.rrd:rtt:AVERAGE \

    DEF:packetloss=ping_wan.rrd:pl:AVERAGE \

    CDEF:PLNone=packetloss,0,2,LIMIT,UN,UNKN,INF,IF \

    CDEF:PL2=packetloss,2,8,LIMIT,UN,UNKN,INF,IF \

    CDEF:PL15=packetloss,8,15,LIMIT,UN,UNKN,INF,IF \

    CDEF:PL25=packetloss,15,25,LIMIT,UN,UNKN,INF,IF \

    CDEF:PL50=packetloss,25,50,LIMIT,UN,UNKN,INF,IF \

    CDEF:PL75=packetloss,50,75,LIMIT,UN,UNKN,INF,IF \

    CDEF:PL100=packetloss,75,100,LIMIT,UN,UNKN,INF,IF \

    AREA:roundtrip#4444ff:"Round Trip Time (millis)" \

    GPRINT:roundtrip:LAST:"Cur\: %5.2lf" \

    GPRINT:roundtrip:AVERAGE:"Avg\: %5.2lf" \

    GPRINT:roundtrip:MAX:"Max\: %5.2lf" \

    GPRINT:roundtrip:MIN:"Min\: %5.2lf\n" \

    AREA:PLNone#6c9bcd:"0-2%":STACK \

    AREA:PL2#00ffae:"2-8%":STACK \

    AREA:PL15#ccff00:"8-15%":STACK \

    AREA:PL25#ffff00:"15-25%":STACK \

    AREA:PL50#ffcc66:"25-50%":STACK \

    AREA:PL75#ff9900:"50-75%":STACK \

    AREA:PL100#ff0000:"75-100%":STACK \

    COMMENT:"(Packet Loss Percentage)"

echo "

<img src="ping_wan_week.png"><br>

<br>

<H3>Monthly Round-Trip & Packetloss Stats(1min average)</H3>

" >> index.html

rrdtool graph ping_wan_month.png -h 225 -w 600 -a PNG \

        --imginfo '<IMG SRC=/stats/%s WIDTH=%lu HEIGHT=%lu >' \

        --lazy --start -2592000 --end -7200 \

    -v "Round-Trip Time (ms)" \

    --rigid \

    --lower-limit 0 \

    DEF:roundtrip=ping_wan.rrd:rtt:AVERAGE \

    DEF:packetloss=ping_wan.rrd:pl:AVERAGE \

    CDEF:PLNone=packetloss,0,2,LIMIT,UN,UNKN,INF,IF \

    CDEF:PL2=packetloss,2,8,LIMIT,UN,UNKN,INF,IF \

    CDEF:PL15=packetloss,8,15,LIMIT,UN,UNKN,INF,IF \

    CDEF:PL25=packetloss,15,25,LIMIT,UN,UNKN,INF,IF \

    CDEF:PL50=packetloss,25,50,LIMIT,UN,UNKN,INF,IF \

    CDEF:PL75=packetloss,50,75,LIMIT,UN,UNKN,INF,IF \

    CDEF:PL100=packetloss,75,100,LIMIT,UN,UNKN,INF,IF \

    AREA:roundtrip#4444ff:"Round Trip Time (millis)" \

    GPRINT:roundtrip:LAST:"Cur\: %5.2lf" \

    GPRINT:roundtrip:AVERAGE:"Avg\: %5.2lf" \

    GPRINT:roundtrip:MAX:"Max\: %5.2lf" \

    GPRINT:roundtrip:MIN:"Min\: %5.2lf\n" \

    AREA:PLNone#6c9bcd:"0-2%":STACK \

    AREA:PL2#00ffae:"2-8%":STACK \

    AREA:PL15#ccff00:"8-15%":STACK \

    AREA:PL25#ffff00:"15-25%":STACK \

    AREA:PL50#ffcc66:"25-50%":STACK \

    AREA:PL75#ff9900:"50-75%":STACK \

    AREA:PL100#ff0000:"75-100%":STACK \

    COMMENT:"(Packet Loss Percentage)"

echo "

<img src="ping_wan_month.png"><br>

<br>

<H3>Yearly Round-Trip & Packetloss Stats(1min average)</H3>

" >> index.html

rrdtool graph ping_wan_year.png \

        --imginfo '<IMG SRC=/stats/%s WIDTH=%lu HEIGHT=%lu >' \

        --lazy --start -31536000 --end -86400 -h 225 -w 600 -a PNG \

    -v "Round-Trip Time (ms)" \

    --rigid \

    --lower-limit 0 \

    DEF:roundtrip=ping_wan.rrd:rtt:AVERAGE \

    DEF:packetloss=ping_wan.rrd:pl:AVERAGE \

    CDEF:PLNone=packetloss,0,2,LIMIT,UN,UNKN,INF,IF \

    CDEF:PL2=packetloss,2,8,LIMIT,UN,UNKN,INF,IF \

    CDEF:PL15=packetloss,8,15,LIMIT,UN,UNKN,INF,IF \

    CDEF:PL25=packetloss,15,25,LIMIT,UN,UNKN,INF,IF \

    CDEF:PL50=packetloss,25,50,LIMIT,UN,UNKN,INF,IF \

    CDEF:PL75=packetloss,50,75,LIMIT,UN,UNKN,INF,IF \

    CDEF:PL100=packetloss,75,100,LIMIT,UN,UNKN,INF,IF \

    AREA:roundtrip#4444ff:"Round Trip Time (millis)" \

    GPRINT:roundtrip:LAST:"Cur\: %5.2lf" \

    GPRINT:roundtrip:AVERAGE:"Avg\: %5.2lf" \

    GPRINT:roundtrip:MAX:"Max\: %5.2lf" \

    GPRINT:roundtrip:MIN:"Min\: %5.2lf\n" \

    AREA:PLNone#6c9bcd:"0-2%":STACK \

    AREA:PL2#00ffae:"2-8%":STACK \

    AREA:PL15#ccff00:"8-15%":STACK \

    AREA:PL25#ffff00:"15-25%":STACK \

    AREA:PL50#ffcc66:"25-50%":STACK \

    AREA:PL75#ff9900:"50-75%":STACK \

    AREA:PL100#ff0000:"75-100%":STACK \

    COMMENT:"(Packet Loss Percentage)"

echo "

<img src="ping_wan_year.png"><br>

<br>

</BODY>

</HTML>

" >> index.html
If you have changed /var/rrds/ping on step (a) you need to change it here in the beggining of the script too.
The above script creates a very simple index.html file inside /var/rrds/ping (unless you’ve changed it) with 5 graphs: hourly, daily, weekly, monthly and yearly
d) Add the following entries to your crontab:
*/5 * * * * /etc/mrtg/ping.sh

1,6,11,16,21,26,31,36,41,46,51,56 * * * * /path/to/ping-graph.sh
For better accuracy, you can change “–step 300” to “–step 60” in the rrd database creation script and then change the crontab entry for ping.sh from:
*/5 * * * * /etc/mrtg/ping.sh
to
* * * * * /etc/mrtg/ping.sh
Original ping script and rrd config for the graphs from http://haroon.sis.utoronto.ca/rrd/scripts/
Enjoy your graphs.
 Filed by kargig at 04:04 under Linux,Networking
 15 Comments | 33,907 views
