Linux network troubleshooting a la Dr. House

Intro

The following story is inspired by a recent case I had to troubleshoot at work. I think it is a nice example of troubleshooting Linux networking issues, so I’ve modified/simplified the setup a bit to be able to reproduce it on a VM. I’ll go through the troubleshooting steps in almost the same way we handled the actual case. Service names, IPs, ports, etc are all different that the real case as the focus should not be the example itself but the process.

It all started a few days ago when I was asked to help on an “unusual” case. Docker containers on every single host of an installation could not establish connections towards services that listen on the “main” IP of the host they run on, nor can they ping that IP, but the containers have full access to the internet and can connect to the service ports on other hosts in the LAN. As everyone who has done even a tiny bit of support, asking whether something changed recently in the setup is always replied back with a single global truth: “nothing has recently changed, it just stopped working”.
Challenge accepted!

Reproduction setup

For reproduction purposes I’ve used a VM with one ethernet interface, and a docker bridge. In this VM I have injected the same problem as with the real case. Even though the real case case was a bit more complicated, to make following the post somewhat easier, I’ve used only one service listening on the host, an Elasticsearch process, and only one Kibana docker container that needs to communicate with Elasticsearch on the host.

Troubleshooting process

Host interfaces:

2: ens5: <BROADCAST,MULTICAST,UP,LOWER_UP> mtu 9001 qdisc mq state UP group default qlen 1000
    link/ether 06:ce:3b:94:fe:ac brd ff:ff:ff:ff:ff:ff
    inet 172.31.45.100/20 brd 172.31.47.255 scope global dynamic ens5
       valid_lft 3572sec preferred_lft 3572sec
    inet6 fe80::4ce:3bff:fe94:feac/64 scope link 
       valid_lft forever preferred_lft forever
3: docker0: <BROADCAST,MULTICAST,UP,LOWER_UP> mtu 1500 qdisc noqueue state UP group default 
    link/ether 02:42:e9:38:3d:a8 brd ff:ff:ff:ff:ff:ff
    inet 172.17.0.1/16 scope global docker0
       valid_lft forever preferred_lft forever
    inet6 fe80::42:e9ff:fe38:3da8/64 scope link 
       valid_lft forever preferred_lft forever

Kibana’s config has the following ENV variable set ELASTICSEARCH_HOSTS=http://172.31.45.100:9200, and for simplification purposes let’s assume that this IP could not be changed.

As originally described, curl from the container towards the service IP:port does not work

(container) bash-4.2$ curl -v 172.31.45.100:9200
* About to connect() to 172.31.45.100 port 9200 (#0)
*   Trying 172.31.45.100...

it just hangs there without error. There’s no DNS resolution involved here, straight curl towards the IP:port

Let’s check if the service is actually listening on the host

[root@ip-172-31-45-100 ~]# ss -ltnp | grep 9200
LISTEN      0      128                             [::]:9200                                  [::]:*                   users:(("java",pid=17892,fd=257))

The service listens on 9200. Since the service listens on all interfaces, let’s curl from the container towards the service IP:port on the docker0 interface.

bash-4.2$ curl -v 172.17.0.1:9200
* About to connect() to 172.17.0.1 port 9200 (#0)
*   Trying 172.17.0.1...
* Connected to 172.17.0.1 (172.17.0.1) port 9200 (#0)
> GET / HTTP/1.1
> User-Agent: curl/7.29.0
> Host: 172.17.0.1:9200
> Accept: */*
> 
< HTTP/1.1 200 OK
< content-type: application/json; charset=UTF-8
< content-length: 524
< 
{
  "name" : "node1",
  "cluster_name" : "centos7",
  "cluster_uuid" : "d6fBSua6Q9OvSu534roTpA",
  "version" : {
    "number" : "7.7.0",
    "build_flavor" : "default",
    "build_type" : "rpm",
    "build_hash" : "81a1e9eda8e6183f5237786246f6dced26a10eaf",
    "build_date" : "2020-05-12T02:01:37.602180Z",
    "build_snapshot" : false,
    "lucene_version" : "8.5.1",
    "minimum_wire_compatibility_version" : "6.8.0",
    "minimum_index_compatibility_version" : "6.0.0-beta1"
  },
  "tagline" : "You Know, for Search"
}

that works, so the service is running properly. Curl-ing the service from the host using the host’s IP also works

[root@ip-172-31-45-100 ~]# curl http://172.31.45.100:9200
{
  "name" : "node1",
  "cluster_name" : "centos7",
  "cluster_uuid" : "d6fBSua6Q9OvSu534roTpA",
  "version" : {
    "number" : "7.7.0",
    "build_flavor" : "default",
    "build_type" : "rpm",
    "build_hash" : "81a1e9eda8e6183f5237786246f6dced26a10eaf",
    "build_date" : "2020-05-12T02:01:37.602180Z",
    "build_snapshot" : false,
    "lucene_version" : "8.5.1",
    "minimum_wire_compatibility_version" : "6.8.0",
    "minimum_index_compatibility_version" : "6.0.0-beta1"
  },
  "tagline" : "You Know, for Search"
}

Let’s check for internet connectivity from the container

bash-4.2$ curl -v 1.1.1.1
* About to connect() to 1.1.1.1 port 80 (#0)
*   Trying 1.1.1.1...
* Connected to 1.1.1.1 (1.1.1.1) port 80 (#0)
> GET / HTTP/1.1
> User-Agent: curl/7.29.0
> Host: 1.1.1.1
> Accept: */*
> 
< HTTP/1.1 301 Moved Permanently
< Date: Sun, 31 May 2020 10:10:27 GMT
< Content-Type: text/html
< Transfer-Encoding: chunked
< Connection: keep-alive
< Location: https://1.1.1.1/
< Served-In-Seconds: 0.000
< CF-Cache-Status: HIT
< Age: 5334
< Expires: Sun, 31 May 2020 14:10:27 GMT
< Cache-Control: public, max-age=14400
< cf-request-id: 030bcf27a3000018e57f0f5200000001
< Server: cloudflare
< CF-RAY: 59bfe7b90b7518e5-FRA
< 
<html>
<head><title>301 Moved Permanently</title></head>
<body bgcolor="white">
<center><h1>301 Moved Permanently</h1></center>
<hr><center>cloudflare-lb</center>
</body>
</html>

internet connectivity for the container works just fine. Let’s curl to another host in the same LAN on the same service port.

bash-4.2$ curl -v 172.31.45.101:9200
* About to connect() to 172.31.45.101 port 9200 (#0)
*   Trying 172.31.45.101...
* Connected to 172.31.45.101 (172.31.45.101) port 9200 (#0)
> GET / HTTP/1.1
> User-Agent: curl/7.29.0
> Host: 172.31.45.101:9200
> Accept: */*
> 
< HTTP/1.1 200 OK
< content-type: application/json; charset=UTF-8
< content-length: 524
< 
{
  "name" : "node2",
  "cluster_name" : "centos7",
  "cluster_uuid" : "d6fBSua6Q9OvSu534roTpA",
  "version" : {
    "number" : "7.7.0",
    "build_flavor" : "default",
    "build_type" : "rpm",
    "build_hash" : "81a1e9eda8e6183f5237786246f6dced26a10eaf",
    "build_date" : "2020-05-12T02:01:37.602180Z",
    "build_snapshot" : false,
    "lucene_version" : "8.5.1",
    "minimum_wire_compatibility_version" : "6.8.0",
    "minimum_index_compatibility_version" : "6.0.0-beta1"
  },
  "tagline" : "You Know, for Search"
}

That also works. Time to use the swiss army knife of network troubleshooting, tcpdump. If you want to find which veth interface a container uses you can either use dockerveth or use the following commands to figure it out manually.
Get the iflink of container’s eth0:

[root@ip-172-31-45-100 ~]# docker exec -it <container-name> bash -c 'cat /sys/class/net/eth0/iflink'

In this case that would be:

# docker exec -it kibana bash -c 'cat /sys/class/net/eth0/iflink'
41

then find the file name of the ifindex that contains that link number in `/sys/class/net/veth*/ifindex` of the host

[root@ip-172-31-45-100 ~]# grep -lw 41 /sys/class/net/veth*/ifindex
/sys/class/net/veth0006ca6/ifindex

`veth0006ca6` is what we need to use. Let’s run tcpdump on it

[root@ip-172-31-45-100 ~]# tcpdump -nni veth0006ca6
10:06:16.745143 IP 172.17.0.2.47166 > 172.31.45.100.9200: Flags [S], seq 1062649548, win 29200, options [mss 1460,sackOK,TS val 1781316 ecr 0,nop,wscale 7], length 0
10:06:16.749126 IP 172.17.0.2.47168 > 172.31.45.100.9200: Flags [S], seq 4174345004, win 29200, options [mss 1460,sackOK,TS val 1781320 ecr 0,nop,wscale 7], length 0
10:06:16.749131 IP 172.17.0.2.47170 > 172.31.45.100.9200: Flags [S], seq 1386880792, win 29200, options [mss 1460,sackOK,TS val 1781320 ecr 0,nop,wscale 7], length 0

the syn packet is seen going out of the container’s veth interface. So let’s tcpdump on docker0

[root@ip-172-31-45-100 ~]# tcpdump -nni docker0
10:07:07.813153 IP 172.17.0.2.47148 > 172.31.45.100.9200: Flags [S], seq 4114480937, win 29200, options [mss 1460,sackOK,TS val 1396384 ecr 0,nop,wscale 7], length 0
10:07:07.845141 IP 172.17.0.2.47144 > 172.31.45.100.9200: Flags [S], seq 3273546229, win 29200, options [mss 1460,sackOK,TS val 1412416 ecr 0,nop,wscale 7], length 0
10:07:07.845147 IP 172.17.0.2.47146 > 172.31.45.100.9200: Flags [S], seq 2062214864, win 29200, options [mss 1460,sackOK,TS val 1412416 ecr 0,nop,wscale 7], length 0

the syn packet can also be seen on the docker0 bridge. The syn packet cannot be seen on the interface (ens5) that has the service IP (172.31.45.100) on it, since it doesn’t traverse that link to go outside the host.

[root@ip-172-31-45-100 ~]# tcpdump -nni ens5 port 9200 or icmp
tcpdump: verbose output suppressed, use -v or -vv for full protocol decode
listening on ens5, link-type EN10MB (Ethernet), capture size 262144 bytes

Let’s check routing entries.

[root@ip-172-31-45-100 ~]# ip route ls
default via 172.31.32.1 dev ens5 
172.17.0.0/16 dev docker0 proto kernel scope link src 172.17.0.1 
172.31.32.0/20 dev ens5 proto kernel scope link src 172.31.45.100 

Nothing interesting here at all. Time to check iptables.

[root@ip-172-31-45-100 ~]# iptables -nxvL
Chain INPUT (policy ACCEPT 169 packets, 27524 bytes)
    pkts      bytes target     prot opt in     out     source               destination         

Chain FORWARD (policy DROP 0 packets, 0 bytes)
    pkts      bytes target     prot opt in     out     source               destination         
     368    27870 DOCKER-ISOLATION  all  --  *      *       0.0.0.0/0            0.0.0.0/0           
     184    14254 DOCKER     all  --  *      docker0  0.0.0.0/0            0.0.0.0/0           
     184    14254 ACCEPT     all  --  *      docker0  0.0.0.0/0            0.0.0.0/0            ctstate RELATED,ESTABLISHED
     184    13616 ACCEPT     all  --  docker0 !docker0  0.0.0.0/0            0.0.0.0/0           
       0        0 ACCEPT     all  --  docker0 docker0  0.0.0.0/0            0.0.0.0/0           

Chain OUTPUT (policy ACCEPT 109 packets, 10788 bytes)
    pkts      bytes target     prot opt in     out     source               destination         

Chain DOCKER (1 references)
    pkts      bytes target     prot opt in     out     source               destination         

Chain DOCKER-ISOLATION (1 references)
    pkts      bytes target     prot opt in     out     source               destination         
     368    27870 RETURN     all  --  *      *       0.0.0.0/0            0.0.0.0/0      

[root@ip-172-31-45-100 ~]# iptables -nxvL -t nat
Chain PREROUTING (policy ACCEPT 0 packets, 0 bytes)
    pkts      bytes target     prot opt in     out     source               destination         
     204    12200 DOCKER     all  --  *      *       0.0.0.0/0            0.0.0.0/0            ADDRTYPE match dst-type LOCAL

Chain INPUT (policy ACCEPT 0 packets, 0 bytes)
    pkts      bytes target     prot opt in     out     source               destination         

Chain OUTPUT (policy ACCEPT 6 packets, 456 bytes)
    pkts      bytes target     prot opt in     out     source               destination         
       0        0 DOCKER     all  --  *      *       0.0.0.0/0           !127.0.0.0/8          ADDRTYPE match dst-type LOCAL

Chain POSTROUTING (policy ACCEPT 6 packets, 456 bytes)
    pkts      bytes target     prot opt in     out     source               destination         
      92     6808 MASQUERADE  all  --  *      !docker0  172.17.0.0/16        0.0.0.0/0           

Chain DOCKER (2 references)
    pkts      bytes target     prot opt in     out     source               destination         
     191    11460 RETURN     all  --  docker0 *       0.0.0.0/0            0.0.0.0/0  

[root@ip-172-31-45-100 ~]# iptables -nxvL -t mangle
Chain PREROUTING (policy ACCEPT 0 packets, 0 bytes)
    pkts      bytes target     prot opt in     out     source               destination         

Chain INPUT (policy ACCEPT 0 packets, 0 bytes)
    pkts      bytes target     prot opt in     out     source               destination         

Chain FORWARD (policy ACCEPT 0 packets, 0 bytes)
    pkts      bytes target     prot opt in     out     source               destination         

Chain OUTPUT (policy ACCEPT 0 packets, 0 bytes)
    pkts      bytes target     prot opt in     out     source               destination         

Chain POSTROUTING (policy ACCEPT 0 packets, 0 bytes)
    pkts      bytes target     prot opt in     out     source               destination  

There’s not even a DROP rule at all and all the policies are set to ACCEPT. iptables is definitely not dropping the connection. Even if there was a DROP rule, we would see the packet on tcpdump…so where’s the packet going ?

Let’s add an extra rule for both FORWARD and INPUT chains just to see if iptables can match these rules as the packets are passing by.

[root@ip-172-31-45-100 ~]# iptables -I INPUT -p tcp --dport 9200
[root@ip-172-31-45-100 ~]# iptables -I FORWARD -p tcp --dport 9200

wait for a while and then check the statistics of those 2 rules:

[root@ip-172-31-45-100 ~]# iptables -nxvL | grep 9200
       0        0            tcp  --  *      *       0.0.0.0/0            0.0.0.0/0            tcp dpt:9200
       0        0            tcp  --  *      *       0.0.0.0/0            0.0.0.0/0            tcp dpt:9200

no packets match these 2 rules at all! Time to inspect the container and the docker bridge network.

[root@ip-172-31-45-100 ~]# docker network inspect bridge
[
    {
        "Name": "bridge",
        "Id": "a6290df54ea24d14faa8d003d17802b3f8a4967680bc0c82c1211ab75d1815e2",
        "Created": "2020-05-31T09:40:19.81958733Z",
        "Scope": "local",
        "Driver": "bridge",
        "EnableIPv6": false,
        "IPAM": {
            "Driver": "default",
            "Options": null,
            "Config": [
                {
                    "Subnet": "172.17.0.0/16"
                }
            ]
        },
        "Internal": false,
        "Attachable": false,
        "Containers": {},
        "Options": {
            "com.docker.network.bridge.default_bridge": "true",
            "com.docker.network.bridge.enable_icc": "true",
            "com.docker.network.bridge.enable_ip_masquerade": "true",
            "com.docker.network.bridge.host_binding_ipv4": "0.0.0.0",
            "com.docker.network.bridge.name": "docker0",
            "com.docker.network.driver.mtu": "1500"
        },
        "Labels": {}
    }
]

pretty standard options for the bridge network, even `enable_icc` is set to `true`. What about the container though ?

[root@ip-172-31-45-100 ~]# docker inspect kibana
[
    {
        "Id": "2f08cc190b760361d9aa2951b4c9c407561fe35b8dbdc003f3f535719456f460",
        "Created": "2020-05-31T10:24:11.942315341Z",
        "Path": "/usr/local/bin/dumb-init",
        "Args": [
            "--",
            "/usr/local/bin/kibana-docker"
        ],
        "State": {
            "Status": "running",
            "Running": true,
            "Paused": false,
            "Restarting": false,
            "OOMKilled": false,
            "Dead": false,
            "Pid": 3735,
            "ExitCode": 0,
            "Error": "",
            "StartedAt": "2020-05-31T10:24:12.329214827Z",
            "FinishedAt": "0001-01-01T00:00:00Z"
        },
        "Image": "sha256:eadc7b3d59dd47b1b56f280732f38d16a4b31947cbc758516adbe1df5472b407",
        "ResolvConfPath": "/var/lib/docker/containers/2f08cc190b760361d9aa2951b4c9c407561fe35b8dbdc003f3f535719456f460/resolv.conf",
        "HostnamePath": "/var/lib/docker/containers/2f08cc190b760361d9aa2951b4c9c407561fe35b8dbdc003f3f535719456f460/hostname",
        "HostsPath": "/var/lib/docker/containers/2f08cc190b760361d9aa2951b4c9c407561fe35b8dbdc003f3f535719456f460/hosts",
        "LogPath": "",
        "Name": "/kibana",
        "RestartCount": 0,
        "Driver": "overlay2",
        "MountLabel": "system_u:object_r:svirt_sandbox_file_t:s0:c434,c792",
        "ProcessLabel": "system_u:system_r:svirt_lxc_net_t:s0:c434,c792",
        "AppArmorProfile": "",
        "ExecIDs": null,
        "HostConfig": {
            "Binds": null,
            "ContainerIDFile": "",
            "LogConfig": {
                "Type": "journald",
                "Config": {}
            },
            "NetworkMode": "bridge",
            "PortBindings": {
                "5601/tcp": [
                    {
                        "HostIp": "",
                        "HostPort": "5601"
                    }
                ]
            },
            "RestartPolicy": {
                "Name": "no",
                "MaximumRetryCount": 0
            },
            "AutoRemove": true,
            "VolumeDriver": "",
            "VolumesFrom": null,
            "CapAdd": null,
            "CapDrop": null,
            "Dns": [],
            "DnsOptions": [],
            "DnsSearch": [],
            "ExtraHosts": null,
            "GroupAdd": null,
            "IpcMode": "",
            "Cgroup": "",
            "Links": null,
            "OomScoreAdj": 0,
            "PidMode": "",
            "Privileged": false,
            "PublishAllPorts": false,
            "ReadonlyRootfs": false,
            "SecurityOpt": null,
            "UTSMode": "",
            "UsernsMode": "",
            "ShmSize": 67108864,
            "Runtime": "docker-runc",
            "ConsoleSize": [
                0,
                0
            ],
            "Isolation": "",
            "CpuShares": 0,
            "Memory": 0,
            "NanoCpus": 0,
            "CgroupParent": "",
            "BlkioWeight": 0,
            "BlkioWeightDevice": null,
            "BlkioDeviceReadBps": null,
            "BlkioDeviceWriteBps": null,
            "BlkioDeviceReadIOps": null,
            "BlkioDeviceWriteIOps": null,
            "CpuPeriod": 0,
            "CpuQuota": 0,
            "CpuRealtimePeriod": 0,
            "CpuRealtimeRuntime": 0,
            "CpusetCpus": "",
            "CpusetMems": "",
            "Devices": [],
            "DiskQuota": 0,
            "KernelMemory": 0,
            "MemoryReservation": 0,
            "MemorySwap": 0,
            "MemorySwappiness": -1,
            "OomKillDisable": false,
            "PidsLimit": 0,
            "Ulimits": null,
            "CpuCount": 0,
            "CpuPercent": 0,
            "IOMaximumIOps": 0,
            "IOMaximumBandwidth": 0
        },
        "GraphDriver": {
            "Name": "overlay2",
            "Data": {
                "LowerDir": "/var/lib/docker/overlay2/84217deb518fa6b50fb38aab03aa6a819150e0a248cf233bda8091b136c4825a-init/diff:/var/lib/docker/overlay2/bfda0aa2ec51f7047b5694e5daf89735f3021691e6154bc370827c168c4572f0/diff:/var/lib/docker/overlay2/5d32d74a3bb95b8e3377b1c115622f12a817a591936c4ae2da4512bc2e281e4b/diff:/var/lib/docker/overlay2/6482e711a89a90bebd61834aa8bd3463f567684dd3cdbbf2698179b752fdad7b/diff:/var/lib/docker/overlay2/4ae81e6a07956c974d985674c35e113ad3fbd9f4fdde43f4752c0e36a1153e69/diff:/var/lib/docker/overlay2/8330cdd839ec316133d659805f2839d1e65b16fbf7035324f419c2aa8d097925/diff:/var/lib/docker/overlay2/cd377c8c6fb23d050771d55ca15253cc9fa5043c7e49f41a2f73acd25f8e7ca9/diff:/var/lib/docker/overlay2/408c72d7e496be76503bbb01d5248c25be98e2290d71cae83d8d5d09d714f81d/diff:/var/lib/docker/overlay2/20068d51c4dd214db7b2b9d30fe13feb2e8ab35de646c9b652fea255476d396b/diff:/var/lib/docker/overlay2/0fdedfd6dbb551d32a9e826188a74936d0cec56e97c1b917fdd04b0e49a59a70/diff:/var/lib/docker/overlay2/0238ff31fbd60fdeaee1e162c92a1aa46735ec7b17df3b11455c09f18657c30f/diff:/var/lib/docker/overlay2/99a7a64a569e5e524e4139f9cf95bd929744c85c1633bcd8173c9172756c3233/diff",
                "MergedDir": "/var/lib/docker/overlay2/84217deb518fa6b50fb38aab03aa6a819150e0a248cf233bda8091b136c4825a/merged",
                "UpperDir": "/var/lib/docker/overlay2/84217deb518fa6b50fb38aab03aa6a819150e0a248cf233bda8091b136c4825a/diff",
                "WorkDir": "/var/lib/docker/overlay2/84217deb518fa6b50fb38aab03aa6a819150e0a248cf233bda8091b136c4825a/work"
            }
        },
        "Mounts": [],
        "Config": {
            "Hostname": "2f08cc190b76",
            "Domainname": "",
            "User": "kibana",
            "AttachStdin": false,
            "AttachStdout": true,
            "AttachStderr": true,
            "ExposedPorts": {
                "5601/tcp": {}
            },
            "Tty": false,
            "OpenStdin": false,
            "StdinOnce": false,
            "Env": [
                "ELASTICSEARCH_HOSTS=http://172.31.45.100:9200",
                "PATH=/usr/share/kibana/bin:/usr/local/sbin:/usr/local/bin:/usr/sbin:/usr/bin:/sbin:/bin",
                "ELASTIC_CONTAINER=true"
            ],
            "Cmd": [
                "/usr/local/bin/kibana-docker"
            ],
            "Image": "docker.elastic.co/kibana/kibana:7.7.0",
            "Volumes": null,
            "WorkingDir": "/usr/share/kibana",
            "Entrypoint": [
                "/usr/local/bin/dumb-init",
                "--"
            ],
            "OnBuild": null,
            "Labels": {
                "license": "Elastic License",
                "org.label-schema.build-date": "2020-05-12T03:25:49.654Z",
                "org.label-schema.license": "Elastic License",
                "org.label-schema.name": "kibana",
                "org.label-schema.schema-version": "1.0",
                "org.label-schema.url": "https://www.elastic.co/products/kibana",
                "org.label-schema.usage": "https://www.elastic.co/guide/en/kibana/index.html",
                "org.label-schema.vcs-url": "https://github.com/elastic/kibana",
                "org.label-schema.vendor": "Elastic",
                "org.label-schema.version": "7.7.0",
                "org.opencontainers.image.created": "2020-05-04 00:00:00+01:00",
                "org.opencontainers.image.licenses": "GPL-2.0-only",
                "org.opencontainers.image.title": "CentOS Base Image",
                "org.opencontainers.image.vendor": "CentOS"
            }
        },
        "NetworkSettings": {
            "Bridge": "",
            "SandboxID": "258a4a11f55f7425b837c7d5c0420dd344add081be79da7e33c146501dd8f0ec",
            "HairpinMode": false,
            "LinkLocalIPv6Address": "",
            "LinkLocalIPv6PrefixLen": 0,
            "Ports": {
                "5601/tcp": [
                    {
                        "HostIp": "0.0.0.0",
                        "HostPort": "5601"
                    }
                ]
            },
            "SandboxKey": "/var/run/docker/netns/258a4a11f55f",
            "SecondaryIPAddresses": null,
            "SecondaryIPv6Addresses": null,
            "EndpointID": "7126885dddf9ff031f2ff8c3b2cbd14708391dae619020bdb40efe7a849a01c7",
            "Gateway": "172.17.0.1",
            "GlobalIPv6Address": "",
            "GlobalIPv6PrefixLen": 0,
            "IPAddress": "172.17.0.2",
            "IPPrefixLen": 16,
            "IPv6Gateway": "",
            "MacAddress": "02:42:ac:11:00:02",
            "Networks": {
                "bridge": {
                    "IPAMConfig": null,
                    "Links": null,
                    "Aliases": null,
                    "NetworkID": "a6290df54ea24d14faa8d003d17802b3f8a4967680bc0c82c1211ab75d1815e2",
                    "EndpointID": "7126885dddf9ff031f2ff8c3b2cbd14708391dae619020bdb40efe7a849a01c7",
                    "Gateway": "172.17.0.1",
                    "IPAddress": "172.17.0.2",
                    "IPPrefixLen": 16,
                    "IPv6Gateway": "",
                    "GlobalIPv6Address": "",
                    "GlobalIPv6PrefixLen": 0,
                    "MacAddress": "02:42:ac:11:00:02"
                }
            }
        }
    }
]

all looks very normal regarding the docker container. Let’s check sysctl settings in /etc

[root@ip-172-31-45-100 ~]# ls -Fla /etc/sysctl.d/
total 12
drwxr-xr-x.  2 root root   28 May 31 09:34 ./
drwxr-xr-x. 84 root root 8192 May 31 10:15 ../
lrwxrwxrwx.  1 root root   14 May 31 09:34 99-sysctl.conf -> ../sysctl.conf

[root@ip-172-31-45-100 ~]# cat /etc/sysctl.d/99-sysctl.conf 

# sysctl settings are defined through files in
# /usr/lib/sysctl.d/, /run/sysctl.d/, and /etc/sysctl.d/.
#
# Vendors settings live in /usr/lib/sysctl.d/.
# To override a whole file, create a new file with the same in
# /etc/sysctl.d/ and put new settings there. To override
# only specific settings, add a file with a lexically later
# name in /etc/sysctl.d/ and put new settings there.
#
# For more information, see sysctl.conf(5) and sysctl.d(5).

nothing interesting here as well. What if someone has messed up ip forwarding via other means though ?

[root@ip-172-31-45-100 ~]# sysctl -a 2>/dev/null| grep forward | grep -v ipv6
net.ipv4.conf.all.forwarding = 1
net.ipv4.conf.all.mc_forwarding = 0
net.ipv4.conf.default.forwarding = 1
net.ipv4.conf.default.mc_forwarding = 0
net.ipv4.conf.docker0.forwarding = 1
net.ipv4.conf.docker0.mc_forwarding = 0
net.ipv4.conf.ens5.forwarding = 1
net.ipv4.conf.ens5.mc_forwarding = 0
net.ipv4.conf.lo.forwarding = 1
net.ipv4.conf.lo.mc_forwarding = 0
net.ipv4.ip_forward = 1
net.ipv4.ip_forward_use_pmtu = 0

all looks fine here too. Let’s check some more sysctl settings regarding bridge + iptables

[root@ip-172-31-45-100 ~]# sysctl -a 2>/dev/null| grep bridge
net.bridge.bridge-nf-call-arptables = 1
net.bridge.bridge-nf-call-ip6tables = 1
net.bridge.bridge-nf-call-iptables = 1
net.bridge.bridge-nf-filter-pppoe-tagged = 0
net.bridge.bridge-nf-filter-vlan-tagged = 0
net.bridge.bridge-nf-pass-vlan-input-dev = 0

everything still looks fine in these configuration settings, but the packets from the container still can’t reach the host.
Next step is to setup a netcat listening service on the host on a different port and try to connect to it via the container. That still doesn’t work, no packets to be seen on ens5.
Could it be ebtables ? No..no way..but what if…

[root@ip-172-31-45-100 ~]# ebtables -L
Bridge table: filter
Bridge chain: INPUT, entries: 0, policy: ACCEPT
Bridge chain: FORWARD, entries: 0, policy: ACCEPT
Bridge chain: OUTPUT, entries: 0, policy: ACCEPT

still nothing interesting. Could it be a kernel bug ? is this some custom kernel ?

[root@ip-172-31-45-100 ~]# uname -a
Linux ip-172-31-45-100.eu-central-1.compute.internal 3.10.0-1062.12.1.el7.x86_64 #1 SMP Tue Feb 4 23:02:59 UTC 2020 x86_64 x86_64 x86_64 GNU/Linux

nope…that’s a vanilla centos7 kernel. Could it be nftables ? On 3.10 kernel and centos7 ?

[root@ip-172-31-45-100 ~]# nft list tables
-bash: nft: command not found

Nobody uses nftables yet, right ? Another wild thought, are there any ip rules defined ?

[root@ip-172-31-45-100 ~]# ip rule ls
0:    from all lookup local 
100:    from 172.31.45.100 lookup 1 
32766:    from all lookup main 
32767:    from all lookup default 

bingo, there’s a rule with priority 100 that matches the host’s IP address! What is this ip rule doing there ? Let’s check routing table 1 that the lookup of rule 100 points to

[root@ip-172-31-45-100 ~]# ip route ls table 1
default via 172.31.32.1 dev ens5 
172.31.32.0/20 dev ens5 scope link 

at last, here’s the answer!

There’s an IP rule entry that says that packets with a source IP of the ens5 interface should lookup routing entries only in routing table 1, which is not the main routing table. That routing table knows nothing about the docker network (172.17.0.0/16). Let’s delete the rule from the host

[root@ip-172-31-45-100 ~]# ip rule del from 172.31.45.100/32 tab 1 priority 100

and check if the container can contact the service now

(container) bash-4.2$ curl 172.31.45.100:9200
{
  "name" : "node1",
  "cluster_name" : "centos7",
  "cluster_uuid" : "d6fBSua6Q9OvSu534roTpA",
  "version" : {
    "number" : "7.7.0",
    "build_flavor" : "default",
    "build_type" : "rpm",
    "build_hash" : "81a1e9eda8e6183f5237786246f6dced26a10eaf",
    "build_date" : "2020-05-12T02:01:37.602180Z",
    "build_snapshot" : false,
    "lucene_version" : "8.5.1",
    "minimum_wire_compatibility_version" : "6.8.0",
    "minimum_index_compatibility_version" : "6.0.0-beta1"
  },
  "tagline" : "You Know, for Search"
}

Success!

Where’s the SYN+ACK ?

Does the SYN packet reach the listening service ? No…and the reason is rp_filter. Centos7 sets net.ipv4.conf.default.rp_filter=1, so when docker0 interface gets created it is set to net.ipv4.conf.docker0.rp_filter=1.

Here’s what rp_filter values mean according to kernel documentation:

  • 0 – No source validation.
  • 1 – Strict mode as defined in RFC3704 Strict Reverse Path Each incoming packet is tested against the FIB and if the interface is not the best reverse path the packet check will fail. By default failed packets are discarded.
  • 2 – Loose mode as defined in RFC3704 Loose Reverse Path Each incoming packet’s source address is also tested against the FIB and if the source address is not reachable via any interface the packet check will fail.

After reverting the deleted ip rule via ip rule add from 172.31.45.100/32 tab 1 priority 100 and setting sysctl -w net.ipv4.conf.docker0.rp_filter=0 we can see the SYN+ACK packet going out of ens5 interface towards the default gateway.

[root@ip-172-31-45-100 ~]# tcpdump -enni ens5 port 9200
tcpdump: verbose output suppressed, use -v or -vv for full protocol decode
listening on ens5, link-type EN10MB (Ethernet), capture size 262144 bytes
15:44:19.028353 06:ce:3b:94:fe:ac > 06:1b:e5:19:30:12, ethertype IPv4 (0x0800), length 74: 172.31.45.100.9200 > 172.17.0.2.47460: Flags [S.], seq 1431574088, ack 1879007024, win 26847, options [mss 8961,sackOK,TS val 22063599 ecr 22063599,nop,wscale 7], length 0
15:44:20.029163 06:ce:3b:94:fe:ac > 06:1b:e5:19:30:12, ethertype IPv4 (0x0800), length 74: 172.31.45.100.9200 > 172.17.0.2.47460: Flags [S.], seq 1431574088, ack 1879007024, win 26847, options [mss 8961,sackOK,TS val 22064600 ecr 22063599,nop,wscale 7], length 0
15:44:21.229126 06:ce:3b:94:fe:ac > 06:1b:e5:19:30:12, ethertype IPv4 (0x0800), length 74: 172.31.45.100.9200 > 172.17.0.2.47460: Flags [S.], seq 1431574088, ack 1879007024, win 26847, options [mss 8961,sackOK,TS val 22065800 ecr 22063599,nop,wscale 7], length 0

Finding such discarded packets, called martians, in the logs can be done by enabling log_martians via sysctl -w net.ipv4.conf.all.log_martians=1. Example syslog message:

May 31 16:01:08 ip-172-31-45-100 kernel: IPv4: martian source 172.31.45.100 from 172.17.0.2, on dev docker018
May 31 16:01:08 ip-172-31-45-100 kernel: ll header: 00000000: 02 42 e9 38 3d a8 02 42 ac 11 00 02 08 00 .B.8=..B......

But why ?

Why was the rule there in the original case ? Multihoming was tried, it didn’t work as expected and not all the configs were removed. Grep-ing /etc for the host’s IP found the following file:

/etc/sysconfig/network-scripts/rule-ens5:from 172.31.45.100/32 tab 1 priority 100

In multihoming it’s common that packets reaching a host on interface X should also be replied back from interface X. Part of a method to achieve this is to assign each interface its own routing table.

So when asked to troubleshoot networking issues act like Dr. House would, assume the worst.

P.S. thanks to Markos for the comments on improving the blogpost

Firejail with Tor HOWTO

A few years ago I created a set of scripts to start applications inside a linux namespace and automatically “Tor-ify” their network traffic. The main reason behind this effort was to provide some isolation and Tor support for applications that don’t have socks5 support, for example claws-mail. While this worked it was hard to keep adding sandboxing features like the ones firejail already provided. So I decided to take a look at how I could automatically send/receive traffic from a firejail-ed application through Tor.

This blog post is NOT meant to be used as copy/paste commands but to explain why each step is needed and how to overcome the problems found in the path.
If you have reasons to proxy all your traffic through Tor as securely as possible use Tails on a different machine, this guide is NOT for you.

A dedicated bridge
First of all create a Linux bridge and assign an IP address to it. Use this bridge to attach the veth interfaces that firejail creates when using the ‘net’ option. This option creates a new network namespace for each sandboxed application.

# brctl addbr tornet
# ip link set dev tornet up
# ip addr add 10.100.100.1/24 dev tornet

NAT
Then enable NAT from/to your “external” interface (eno1 in my case) for tcp connections and udp port 53 (DNS) and enable IP(v4) forwarding, if you don’t already use it. Some rules about sane default policy for FORWARD chain are added here well, modify to your needs.

# sysctl -w net.ipv4.conf.all.forwarding=1
# iptables -P FORWARD DROP
# iptables -A INPUT -m state --state INVALID -j DROP
# iptables -A INPUT -m state --state RELATED,ESTABLISHED -j ACCEPT
# iptables -A FORWARD -i tornet -o eno1 -p tcp -j ACCEPT
# iptables -A FORWARD -i tornet -o eno1 -p udp --dport=53 -j ACCEPT
# iptables -t nat -A POSTROUTING -s 10.100.100.0/24 -o eno1 -j MASQUERADE

This configuration is enough to start a sandboxed application that will have it’s traffic NAT-ed from the Linux host.

$ firejail --net=tornet /bin/bash
Parent pid 26730, child pid 26731

Interface        MAC                IP               Mask             Status
lo                                  127.0.0.1        255.0.0.0        UP    
eth0             72:cc:f6:d8:6a:09  10.100.100.29    255.255.255.0    UP    
Default gateway 10.100.100.1

$ host www.debian.org
www.debian.org has address 5.153.231.4
Host www.debian.org not found: 3(NXDOMAIN)
Host www.debian.org not found: 4(NOTIMP)
$ host whoami.akamai.net
whoami.akamai.net has address 83.235.72.202
$ curl wtfismyip.com/text
3.4.5.6

(where 3.4.5.6 is your real IP and 83.235.72.202 should be the IP address of the final DNS recursive resolver requesting information from whois.akamai.net)

So NAT works and the shell is sandboxed.

“Tor-ify” traffic
Edit /etc/tor/torrc and enable TransPort and VirtualAddrNetwork Tor features to transparently proxy to the Tor network connections landing on Tor daemon’s port 9040. DNSPort is used to resolve DNS queries through the Tor network. You don’t have to use IsolateDestAddr for your setup, but I like it.

TransPort 9040
VirtualAddrNetwork 172.30.0.0/16
DNSPort 5353 IsolateDestAddr

Then use iptables to redirect traffic from tornet bridge to TransPort and DNSPort specified in torrc. You also need to ACCEPT that traffic in your INPUT chain if your policy is DROP (it is right ?)

# iptables -t nat -A PREROUTING -i tornet -p udp -m udp --dport 53 -j DNAT --to-destination 127.0.0.1:5353
# iptables -t nat -A PREROUTING -i tornet -p tcp -j DNAT --to-destination 127.0.0.1:9040
# iptables -A INPUT -i tornet -p tcp --dport 9040 -j ACCEPT
# iptables -A INPUT -i tornet -p udp --dport 5353 -j ACCEPT

Run your sandbox again and try to access the same website:

$ firejail --net=tornet /bin/bash
$ curl wtfismyip.com/text
curl: (7) Failed to connect to wtfismyip.com port 80: Connection timed out

aaaand nothing happens. The problem is that you have tried to route traffic from a “normal” interface to loopback which is considered a “martian” and is not allowed by default by the Linux kernel.

sysctl magic
To enable loopback to be used for routing the route_localnet sysctl setting must be set.
# sysctl -w net.ipv4.conf.tornet.route_localnet=1

Try again:

$ firejail --net=tornet /bin/bash
$ host whoami.akamai.net
whoami.akamai.net has address 74.125.181.10
Host whoami.akamai.net not found: 3(NXDOMAIN)
Host whoami.akamai.net not found: 4(NOTIMP)
$ curl wtfismyip.com/text
176.10.104.243
$ host 176.10.104.243
243.104.10.176.in-addr.arpa domain name pointer tor2e1.digitale-gesellschaft.ch.

it works!

You can actually run any program you want like that:
$ firejail --net=tornet google-chrome

Accessing onion services
There’s one problem left though, accessing onion services.
If you try and access www.debian.org onion service from your firejail+tor setup you will get an error.

$ firejail --net=tornet /bin/bash
$ curl http://sejnfjrq6szgca7v.onion/
curl: (6) Could not resolve host: sejnfjrq6szgca7v.onion

To fix that you need to modify /etc/tor/torrc again and add AutomapHostsOnResolve option.
AutomapHostsOnResolve 1

$ firejail --net=tornet /bin/bash
$ curl -I http://sejnfjrq6szgca7v.onion/
HTTP/1.1 200 OK
Date: Fri, 09 Dec 2016 12:05:56 GMT
Server: Apache
Content-Location: index.en.html
Vary: negotiate,accept-language,Accept-Encoding
TCN: choice
Last-Modified: Thu, 08 Dec 2016 15:42:34 GMT
ETag: "3a40-543277c74dd5b"
Accept-Ranges: bytes
Content-Length: 14912
Cache-Control: max-age=86400
Expires: Sat, 10 Dec 2016 12:05:56 GMT
X-Clacks-Overhead: GNU Terry Pratchett
Content-Type: text/html
Content-Language: en

Accessing onion services works as well now.

Applications supporting socks5
If you already have some of your applications proxying connections to tor using 127.0.0.1:9050 then you need to add another iptables rule to redirect the socks traffic from inside firejail’s namespace to Tor SocksPort.
# iptables -t nat -A PREROUTING -i tornet -p tcp -m tcp --dport 9050 -j DNAT --to-destination 127.0.0.1:9050

Another day another hacked website

Yesterday morning, phone rings to notify my of a new sms. Someone could not access his website on some server that I am root/administer.
I tried to ping the server and got 1 reply every 10-15 packets so my initial thought was that the hosting provider had fucked up. I pinged other machines in the “neighborhood”, they replied just fine. So the problem lied in my server. I got console access through IPMI, you know…the ones with the cipher zero bug, and I managed to login. An apache2 process was constantly using 100% of a core and the machine sent gazillion packets towards a certain destination.

Since I wanted to investigate what exactly this process did, I put an iptables entry in my OUTPUT chain to block packets towards that destination. The machine became responsive again, though the apache process still ran at 100%. Since I run my vhosts using apache2 mpm_itk module, I knew through the apache2 PIDs’ username which site had been hacked. I grepped the logs for any POST, but I couldn’t see anything. Unfortunately the logs only go back 2 days (NOT my policy! and a very bad one actually…but anyway).

strace -p PID did not yield anything interesting, just the process trying to create sockets to send packets towards the destination.

socket(PF_NETLINK, SOCK_RAW, 0) = 417
bind(417, {sa_family=AF_NETLINK, pid=0, groups=00000000}, 12) = 0
getsockname(417, {sa_family=AF_NETLINK, pid=11398, groups=00000000}, [12]) = 0
sendto(417, "\24\0\0\0\26\0\1\3\233\323\354Q\0\0\0\0\0\0\0\0", 20, 0, {sa_family=AF_NETLINK, pid=0, groups=00000000}, 12) = 20
recvmsg(417, {msg_name(12)={sa_family=AF_NETLINK, pid=0, groups=00000000}, msg_iov(1)=[{"0\0\0\0\24\0\2\0\233\323\354Q\206,\0\0\2\10\200\376\1\0\0\0\10\0\1\0\177\0\0\1"..., 4096}], msg_controllen=0, msg_flags=0}, 0) = 588
recvmsg(417, {msg_name(12)={sa_family=AF_NETLINK, pid=0, groups=00000000}, msg_iov(1)=[{"@\0\0\0\24\0\2\0\233\323\354Q\206,\0\0\n\200\200\376\1\0\0\0\24\0\1\0\0\0\0\0"..., 4096}], msg_controllen=0, msg_flags=0}, 0) = 128
recvmsg(417, {msg_name(12)={sa_family=AF_NETLINK, pid=0, groups=00000000}, msg_iov(1)=[{"\24\0\0\0\3\0\2\0\233\323\354Q\206,\0\0\0\0\0\0\1\0\0\0\24\0\1\0\0\0\0\0"..., 4096}], msg_controllen=0, msg_flags=0}, 0) = 20
close(417) = 0
socket(PF_INET, SOCK_DGRAM, IPPROTO_IP) = 417
fcntl(417, F_GETFL) = 0x2 (flags O_RDWR)
fcntl(417, F_SETFL, O_RDWR|O_NONBLOCK) = 0
connect(417, {sa_family=AF_INET, sin_port=htons(4883), sin_addr=inet_addr("X.Y.Z.W")}, 16) = 0
fcntl(417, F_SETFL, O_RDWR) = 0
sendto(417, "\207\25\312P\322t\0#\317}jf\2(W\374\375\232h\213\220\31\355\277)\320[\255\273\276\221\374"..., 8192, MSG_DONTWAIT, NULL, 0) = -1 EPERM (Operation not permitted)
close(417) = 0

lsof -n -p PID output had hundreds of open log files and a few connections. Grepping out the logs I noticed one that was quite interesting, it went towards another server at port 5555.
apache2 11398 XXXXXXX 416u IPv4 831501972 0t0 TCP A.B.C.D:59210->B.C.D.E:5555 (CLOSE_WAIT)

I run tcpdump there, and of course it was an irc connection. I started capturing everything.

lsof also revealed this:
apache2 11398 XXXXXXX cwd DIR 8,7 4096 2474373 /var/www/vhosts/XXXXXXX/httpdocs/libraries/phpgacl
which I could have have also seen it doing ls /proc/PID/cwd/ …but anyway.

Looking inside that dir I found a file named gacl_db.php. It was base64 encoded. Well actually it was multiple times base64 encoded and obfsuscated by using character substitutions, so I had to de-obfuscate it. It was quite easy using php and some bash scripting.

This is the original base64 encoded/obfuscated file: Original gacl_db.php
This is the final result: Deobfuscated gacl_db.php
(I have removed the irc server details from the deobfuscated file, it’s still there in the original file for whoever wants it though)

It’s just an IRC bot containing a perl reverse shell as well. It has commands to flood other servers, and that’s what my server was doing.

I joined the IRC server and at that time there were more than 90 bots inside. Right now that I’m writing this blog post there are less than 50. Every bot joining the channel outputs a text like this:

[uname!]: FreeBSD a.b.c.d 8.1-RELEASE-p5 FreeBSD 8.1-RELEASE-p5 #10: Fri Sep 30 14:45:56 MSK 2011 root@a.b.c.d:/path/to/to/to/sth pl#27 amd64 (safe: off)
[vuln!]: http://www.a-vhost-name.TLD/libraries/phpgacl/gacl_db.php
[uname!]: Linux x.y.z.w 3.2.0-43-generic #68-Ubuntu SMP Wed May 15 03:33:33 UTC 2013 x86_64 (safe: off)
[vuln!]: http://www.another-vhost-name.another-TLD/libraries/phpgacl/gacl_db.php

So if you run servers or websites, do a locate gacl_db.php.

Since all the bot/servers entering post a [vuln!] message about phpgacl, my guess is that the original vulnerability that allowed the attacker to gain access is right there. I haven’t had time to look into it yet, but I’ve warned my clients to remove this library from their websites as a precaution. You should probably do the same.

How Vodafone Greece degrades my Internet experience

The title may sound a bit pompous, but please read on and you’ll see how certain decisions can cripple, or totally disrupt modern Internet services and communications as these are offered(?) by Vodafone’s mobile Internet solutions.

== The situation ==
I’ve bought a mobile Internet package from Vodafone Greece in order to be able to have 3G access in places where I don’t have access to wifi or ethernet. I am also using a local caching resolver on my laptop (Debian Linux), running unbound software, to both speed up my connections and to have mandatory DNSSEC validation for all my queries. Many of you might ask why do I need DNSSEC validation of all my queries since only very few domains are currently using DNSSEC, well I don’t have a reply that applies to everyone, let’s just say for now that I like to experiment with new things. After all, this is the only way to learn new things, experiment with them. Let’s not forget though that many TLDs are now signed, so there are definitely a few records to play with. Mandatory DNSSEC validation has led me in the past to identify and investigate a couple other problems, mostly having to do with broken DNSSEC records of various domains and more importantly dig deeper into IPv6 and fragmentation issues of various networks. This last topic is so big that it needs a blog post, or even a series of posts, of it’s own. It’s my job after all to find and solve problems, that’s what system or network administrators do (or should do).

== My setup ==
When you connect your 3G dongle with Vodafone Greece, they sent you 2 DNS servers (two out of 213.249.17.10, 213.249.17.11, 213.249.39.29) through ipcp (ppp). In my setup though, I discard them and I just keep “nameserver 127.0.0.1” in my /etc/resolv.conf in order to use my local unbound. In unbound’s configuration I have set up 2 forwarders for my queries, actually when I know I am inside an IPv6 network I use 4 addresses, 2 IPv4 and 2 IPv6 for the same 2 forwarders. These forwarders are hosted where I work (GRNET NOC) and I have also set them up to do mandatory DNSSEC validation themselves.
So my local resolver, which does DNSSEC validation, is contacting 2 other servers who also do DNSSEC validation. My queries carry the DNS protocol flag that asks for DNSSEC validation and I expect them to validate every response possible.

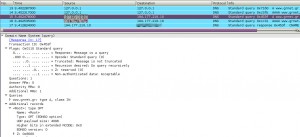
As you can see in the following screenshot, here’s what happens when I want to visit a website. I ask my local caching resolver, and that resolver asks one of it’s forwarders adding the necessary DNSSEC flags in the query.
The response might have the “ad” (authenticated) DNSSEC flag, depending whether the domain I’m visiting is DNSSEC signed or not.

[Screenshot of DNS queries]
dnssec_query

== The problem ==
What I noticed was that using this setup, I couldn’t visit any sites at all when I connected with my 3G dongle on Vodafone’s network. When I changed my /etc/resolv.conf to use Vodafone’s DNS servers directly, everything seemed work as normal, at least for browsing. But then I tried to query for DNSSEC related information on various domains manually using dig, Vodafone’s resolvers never sent me back any DNSSEC related information. Well actually they never sent me back any packet at all when I asked them for DNSSEC data.

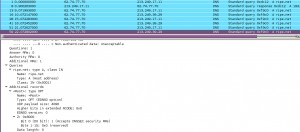
Here’s an example of what happens with and without asking for DNSSEC data. The first query is without requesting DNSSEC information and I get a normal reply, but upon asking for the extra DNSSEC data, I get nothing back.
[Screenshot of ripe.net +dnssec query through Vodafone’s servers]
no_dnssec_replies_by_vodafone

== Experimentation ==
Obviously changing my forwarders configuration in unbound to the Vodafone DNS servers did not work because Vodafone’s DNS servers never send me back any DNSSEC information at all. Since my unbound is trying to do DNSSEC validation of everything, obviously including the root (.) zone, I need to get back packets that contain these records. Else everything fails. I could get unbound working with my previous forwarders or with Vodafone’s servers as forwarders, only by disabling the DNSSEC validation, that is commenting out the auto-trust-anchor-file option.

Then I started doing tests on my original forwarders that I had in my configuration (and are managed by me). I could see that my query packets arrived at the server and the server always sent back the proper replies. But whenever the reply contained DNSSEC data, that packet was not forwarded to my computer through Vodafone’s 3G network.

More tests were to follow and obviously my first choice were Google’s public resolvers, 8.8.8.8 and 8.8.4.4. Surprise, surprise! I could get any DNSSEC related information I wanted. The exact same result I got upon testing with OpenDNS resolvers, 208.67.222.222 and 208.67.220.220. From a list of “fairly known” public DNS servers that I found here, only ScrubIT servers seems to be currently blocked by Vodafone Greece. Comodo DNS, Norton DNS, and public Verizon DNS all work flawlessly.

My last step was to try and get DNSSEC data over tcp instead of udp packets. Surprise, surprise again, well not at all any more… I could get back responses containing the DNSSEC information I wanted.

== Conclusion ==
Vodafone Greece for some strange reason (I have a few ideas, starting with…disabling skype) seems to “dislike” large UDP responses, among which are obviously DNS replies carrying DNSSEC information. These responses can sometimes be even bigger than 1500bytes. My guess is that in order to minimize hassle for their telephone support, they have whitelisted a bunch of “known” DNS servers. Obviously the thought of breaking DNSSEC and every DNSSEC signed domain for their customers hasn’t crossed their minds yet. What I don’t understand though is why their own DNS servers are not whitelisted. Since they trust other organizations’ servers to send big udp packets, why don’t they allow DNSSEC from their own servers? Misconfiguration? Ignorance? On purpose?

The same behavior can (sometimes -> further investigation needed here) be seen while trying to use OpenVPN over udp. Over tcp with the same servers, everything works fine. That reminds me I really need to test ocserv soon…

== Solution ==
I won’t even try to contact Vodafone’s support and try to convince their telephone helpdesk to connect me to one of their network/infrastructure engineers. I think that would be completely futile. If any of you readers though, know anyone working at Vodafone Greece in _any_ technical department, please send them a link to this blog post. You will do a huge favor to all Vodafone Greece mobile Internet users and to the Internet itself.

The Internet is not just for HTTP stuff, many of us use it in various other ways. It is unacceptable for any ISP to block, disrupt, interrupt or get in the middle of such communications.
Each one of us users should be able to use DNSSEC without having to send all our queries to Google, OpenDNS or any other information harvesting organization.

== Downloads ==
I’m uploading some pcaps here for anyone who wants to take a look. Use wireshark/tcpdump to read them.

A. tcpdump querying for a non-DNSSEC signed domain over 3G. One query without asking for DNSSEC and two queries asking for DNSSEC, all queries go to DNS server 194.177.210.10. All queries arrived back. The tcpdump was created on 194.177.210.10.
vf_non-dnssec_domain_query.pcap

B. tcpdump querying for a DNSSEC signed domain over 3G. One query without asking for DNSSEC and three queries asking for DNSSEC, all queries go to DNS server 194.177.210.10. The last three queries never arrived back at my computer. The tcpdump was created on 194.177.210.10.
vf_dnssec_domain_query.pcap

C. tcpdump querying for a DNSSEC signed domain over 3G. One query without asking for DNSSEC and another one asking for DNSSEC, all queries go to DNS Server 8.8.8.8. All queries arrived back. The tcpdump was created on my computer using the PPP interface.
vf_ripe_google_dns.pcap

Linux kernel handling of IPv6 temporary addresses – CVE-2013-0343

I reported this bug on November 2012 but as of February 2013 it still hasn’t been fixed.

My initial report on oss-security and kernel netdev mailing lists reported it as an ‘information disclosure’ problem but then I found out that the issue is more severe and it can lead to the complete corruption of Linux kernel’s IPv6 stack until reboot. My second report wasn’t public, I thought it would be better not to make any public disclosure until the kernel people had enough time to respond, and was only sent to a number of kernel developers but I’m making it public now since the CVE is already out.

If someone wants to read all the publicly exchanged emails the best resource is probably this: http://marc.info/?t=135291265200001&r=1&w=2

Here’s the initial description of the problem:

Due to the way the Linux kernel handles the creation of IPv6 temporary addresses a malicious LAN user can remotely disable them altogether which may lead to privacy violations and information disclosure.

By default the Linux kernel uses the ‘ipv6.max_addresses’ option to specify how many IPv6 addresses an interface may have. The ‘ipv6.regen_max_retry’ option specifies how many times the kernel will try to create a new address.

Currently, in net/ipv6/addrconf.c,lines 898-910, there is no distinction between the events of reaching max_addresses for an interface and failing to generate a new address. Upon reaching any of the above conditions the following error is emitted by the kernel times ‘regen_max_retry’ (default value 3):

[183.793393] ipv6_create_tempaddr(): retry temporary address regeneration
[183.793405] ipv6_create_tempaddr(): retry temporary address regeneration
[183.793411] ipv6_create_tempaddr(): retry temporary address regeneration

After ‘regen_max_retry’ is reached the kernel completely disables temporary address generation for that interface.

[183.793413] ipv6_create_tempaddr(): regeneration time exceeded - disabled temporary address support

RFC4941 3.3.7 specifies that disabling temp_addresses MUST happen upon failure to create non-unique addresses which is not the above case. Addresses would have been created if the kernel had a higher
‘ipv6.max_addresses’ limit.

A malicious LAN user can send a limited amount of RA prefixes and thus disable IPv6 temporary address creation for any Linux host. Recent distributions which enable the IPv6 Privacy extensions by default, like Ubuntu 12.04 and 12.10, are vulnerable to such attacks.

Due to the kernel’s default values for valid (604800) and preferred (86400) lifetimes, this scenario may even occur under normal usage when a Router sends both a public and a ULA prefix, which is not an uncommon
scenario for IPv6. 16 addresses are not enough with the current default timers when more than 1 prefix is advertised.

The kernel should at least differentiate between the two cases of reaching max_addresses and being unable to create new addresses, due to DAD conflicts for example.

And here’s the second, more severe report about the corruption of the IPv6 stack:

I had previously informed this list about the issue of the linux kernel losing IPv6 privacy extensions by a local LAN attacker. Recently I’ve found that there’s actually another, more serious in my
opinion, issue that follows the previous one. If the user tries to disconnect/reconnect the network device/connection for whatever reason (e.g. thinking he might gain back privacy extensions), then the device gets IPs from SLAAC that have the “tentative” flag and never loses that. That means that IPv6 functionality for that device is from then on completely lost. I haven’t been able to bring back the kernel to a working IPv6 state without a reboot.

This is definitely a DoS situation and it needs fixing.

Here are the steps to reproduce:


== Step 1. Boot Ubuntu 12.10 (kernel 3.5.0-17-generic) ==
ubuntu@ubuntu:~$ ip a ls dev eth0
2: eth0: <BROADCAST,MULTICAST,UP,LOWER_UP> mtu 1500 qdisc pfifo_fast state UP qlen 1000
    link/ether 52:54:00:8b:99:5d brd ff:ff:ff:ff:ff:ff
    inet 192.168.1.96/24 brd 192.168.1.255 scope global eth0
    inet6 2001:db8:f00:f00:ad1f:9166:93d4:fd6d/64 scope global temporary dynamic 
       valid_lft 86379sec preferred_lft 3579sec
    inet6 2001:db8:f00:f00:5054:ff:fe8b:995d/64 scope global dynamic 
       valid_lft 86379sec preferred_lft 3579sec
    inet6 fdbb:aaaa:bbbb:cccc:ad1f:9166:93d4:fd6d/64 scope global temporary dynamic 
       valid_lft 86379sec preferred_lft 3579sec
    inet6 fdbb:aaaa:bbbb:cccc:5054:ff:fe8b:995d/64 scope global dynamic 
       valid_lft 86379sec preferred_lft 3579sec
    inet6 fe80::5054:ff:fe8b:995d/64 scope link 
       valid_lft forever preferred_lft forever

ubuntu@ubuntu:~$ sysctl -a | grep use_tempaddr
net.ipv6.conf.all.use_tempaddr = 2
net.ipv6.conf.default.use_tempaddr = 2
net.ipv6.conf.eth0.use_tempaddr = 2
net.ipv6.conf.lo.use_tempaddr = 2

ubuntu@ubuntu:~$ nmcli con status
NAME                      UUID                                   DEVICES    DEFAULT  VPN   MASTER-PATH
Wired connection 1        923e6729-74a7-4389-9dbd-43ed7db3d1b8   eth0       yes      no    --
ubuntu@ubuntu:~$ nmcli dev status
DEVICE     TYPE              STATE
eth0       802-3-ethernet    connected

//ping6 2a00:1450:4002:800::100e  while in another terminal: tcpdump -ni eth0 ip6

ubuntu@ubuntu:~$ ping6 2a00:1450:4002:800::100e -c1
PING 2a00:1450:4002:800::100e(2a00:1450:4002:800::100e) 56 data bytes
64 bytes from 2a00:1450:4002:800::100e: icmp_seq=1 ttl=53 time=70.9 ms

--- 2a00:1450:4002:800::100e ping statistics ---
1 packets transmitted, 1 received, 0% packet loss, time 0ms
rtt min/avg/max/mdev = 70.994/70.994/70.994/0.000 ms

# tcpdump -ni eth0 host 2a00:1450:4002:800::100e
17:57:37.784658 IP6 2001:db8:f00:f00:ad1f:9166:93d4:fd6d > 2a00:1450:4002:800::100e: ICMP6, echo request, seq 1, length 64
17:57:37.855257 IP6 2a00:1450:4002:800::100e > 2001:db8:f00:f00:ad1f:9166:93d4:fd6d: ICMP6, echo reply, seq 1, length 64

== Step 2. flood RAs on the LAN ==

$ dmesg | tail
[ 1093.642053] IPv6: ipv6_create_tempaddr: retry temporary address regeneration
[ 1093.642062] IPv6: ipv6_create_tempaddr: retry temporary address regeneration
[ 1093.642065] IPv6: ipv6_create_tempaddr: retry temporary address regeneration
[ 1093.642067] IPv6: ipv6_create_tempaddr: regeneration time exceeded - disabled temporary address support

ubuntu@ubuntu:~$ sysctl -a | grep use_tempaddr
net.ipv6.conf.all.use_tempaddr = 2
net.ipv6.conf.default.use_tempaddr = 2
net.ipv6.conf.eth0.use_tempaddr = -1
net.ipv6.conf.lo.use_tempaddr = 2

//ping6 2a00:1450:4002:800::100e  while in another terminal: tcpdump -ni eth0 ip6

ubuntu@ubuntu:~$ ping6 2a00:1450:4002:800::100e -c1
PING 2a00:1450:4002:800::100e(2a00:1450:4002:800::100e) 56 data bytes
64 bytes from 2a00:1450:4002:800::100e: icmp_seq=1 ttl=53 time=77.5 ms

--- 2a00:1450:4002:800::100e ping statistics ---
1 packets transmitted, 1 received, 0% packet loss, time 0ms
rtt min/avg/max/mdev = 77.568/77.568/77.568/0.000 ms

# tcpdump -ni eth0 host 2a00:1450:4002:800::100e
17:59:38.204173 IP6 2001:db8:f00:f00:5054:ff:fe8b:995d > 2a00:1450:4002:800::100e: ICMP6, echo request, seq 1, length 64
17:59:38.281437 IP6 2a00:1450:4002:800::100e > 2001:db8:f00:f00:5054:ff:fe8b:995d: ICMP6, echo reply, seq 1, length 64

//notice the change of IPv6 address to the one not using privacy extensions even after the flooding has finished long ago.

== Step 3. Disconnect/Reconnect connection  ==
// restoring net.ipv6.conf.eth0.use_tempaddr to value '2' makes no difference at all for the rest of the process

# nmcli dev disconnect iface eth0
# nmcli con up uuid 923e6729-74a7-4389-9dbd-43ed7db3d1b8

ubuntu@ubuntu:~$ ip a ls dev eth0
2: eth0: <BROADCAST,MULTICAST,UP,LOWER_UP> mtu 1500 qdisc pfifo_fast state UP qlen 1000
    link/ether 52:54:00:8b:99:5d brd ff:ff:ff:ff:ff:ff
    inet 192.168.1.96/24 brd 192.168.1.255 scope global eth0
    inet6 2001:db8:f00:f00:5054:ff:fe8b:995d/64 scope global tentative dynamic 
       valid_lft 86400sec preferred_lft 3600sec
    inet6 fdbb:aaaa:bbbb:cccc:5054:ff:fe8b:995d/64 scope global tentative dynamic 
       valid_lft 86400sec preferred_lft 3600sec
    inet6 fe80::5054:ff:fe8b:995d/64 scope link tentative 
       valid_lft forever preferred_lft forever

//Notice the "tentative" flag of the IPs on the device

//ping6 2a00:1450:4002:800::100e  while in another terminal: tcpdump -ni eth0 ip6

ubuntu@ubuntu:~$ ping6 2a00:1450:4002:800::100e -c1
PING 2a00:1450:4002:800::100e(2a00:1450:4002:800::100e) 56 data bytes
^C
--- 2a00:1450:4002:800::100e ping statistics ---
1 packets transmitted, 0 received, 100% packet loss, time 0ms

# tcpdump -ni eth0 host 2a00:1450:4002:800::100e
18:01:45.264194 IP6 ::1 > 2a00:1450:4002:800::100e: ICMP6, echo request, seq 1, length 64

Summary:
Before flooding it uses IP: 2001:db8:f00:f00:ad1f:9166:93d4:fd6d
After flooding it uses IP: 2001:db8:f00:f00:5054:ff:fe8b:995d –> it has lost privacy extensions
After disconnect/reconnect it tries to use IP: ::1 –> it has lost IPv6 connectivity

The problem currently affects all Linux kernels (including the latest 3.8), that have IPv6 Privacy Extensions enabled. The only distribution that has IPv6 Privacy Extensions enabled by default is Ubuntu starting from version 12.04. So Ubuntu 12.04 and 12.10 are currently vulnerable to this attack and can have their IPv6 stack corrupted/disabled by a remote attacker in an untrusted network.

Kernel developers and people from RedHat Security Team are trying to fix the issue which in my opinion involves changing parts of the logic of IPv6 addressing algorithms in the Linux kernel.

No mitigation currently exists apart from disabling IPv6 Privacy Extensions.

You can play with this bug using flood_router26 tool from THC-IPv6 toolkit v2.1.
Usage: # ./flood_router26 -A iface

P.S. I can’t tell if the stack corruption could also lead to other kernel problems, that would probably need some professional security researchers to look into it.

mitigating wordpress xmlrpc attack using ossec

I’ve created some local rules for ossec to mitigate some of the effects of the wordpress xmlrpc attack presented here: WordPress Pingback Portscanner – Metasploit Module.

They seem to work for me, use at your own risk of getting flooded with tons of alerts. Obviously you need to set the alert level of the second rule to something that will trigger your active-response. Feel free to tweak the alert level, frequency and timeframe. Before you change frequency to something else please read the following thread though: setting ossec frequency level


   <rule id="100167" level="1">
    <if_sid>31108</if_sid>
    <url>xmlrpc.php</url>
    <match>POST</match>
    <description>WordPress xmlrpc attempt.</description>
  </rule>

  <rule id="100168" level="10" frequency="2" timeframe="600">
    <if_matched_sid>100167</if_matched_sid>
    <same_source_ip />
    <description>WordPress xmlrpc attack.</description>
    <group>attack,</group>
   </rule>

btw, if you don’t want xmlrpc.php accessible at all, you can block it through a simple mod_rewrite rule:


<IfModule mod_rewrite.c>
RewriteEngine On
RewriteCond %{REQUEST_URI} ^/PATH/TO/xmlrpc.php [NC]
RewriteRule ^(.*)$ - [F,L]

or you can try any of the other numerous ways to accomplish the same thing as presented here.

You’ll lose pingback functionality though…oh well.

Scaling a small streaming system from 50 to 4000+ users

This post was originally written on 09/11/2012 but for various reasons it couldn’t be published earlier. It won’t be very technical, it’s mostly a behind the scenes view of how some of us at NOC GRNET tried to cope with an extreme spike of demands of a specific service we support.

Intro
At GRNET we provide a live streaming service to the Hellenic Parliament, who also connect to the Internet through our network. What we’re doing is that we’re serving the official TV channel of the Hellenic Parliament (the WebTV program actually). We have a machine that encodes (transcodes actually) video/audio and a separate streamer that serves the content to the clients via RTSP, RTMP and HTTP. While this service has been running for quite some time, and the streaming server has been used in various other occasions, it typically serves no more than 100 concurrent clients. With a stream at 640Kbps on average that’s abound 60Mbps of streaming traffic. The number of viewers usually goes up only when there’s something exciting going on. Our previous traffic spike was at 577Mbps on October 31st, when the Minister of Finance was presenting the budget for 2013 to the Parliament. What happened that day was that news reporters were on strike and it seems that one of the few news sources available at the time for people to use was the Parliament channel, either on the TV or through our stream. The viewership that day surpassed all previous expectations but the streaming system actually performed quite well considering we didn’t have any complaints.

Remember, remember the 7th of November
On the 7th of November almost everyone was on strike in Greece. There was a huge march arranged at 17:00 outside of the Greek Parliament to protest against the new harsh measures of Memorandum III that the parliament was to vote for at midnight.

We started seeing some traffic arriving, well leaving is more accurate, our streaming server at around 10:00 in the morning. Some news sites and blogs (tanea.gr, left.gr, protothema.gr) had already started posting links to our parliament’s streaming service for people to watch the discussion that was already taking place. At around 10:30 we were already serving more than 100Mbps while the traffic was steadily rising. A bit after 12:00 though things got really nasty. Websites like tovima.gr, zougla.gr and newsit.gr had posted our streaming links in their very first page. The discussions both inside the parliament and on the social networks had also started heating up. At 12:25 the traffic starting ramping up extremely fast!

12:25 160Mbps
12:32 367Mbps
12:38 597Mbps
12:42 756Mbps
12:49 779Mbps

That’s when traffic stopped growing any more. We actually saw some drop in the traffic and then up to 780Mbps and down again. It was obvious that we had reached some limit. It wasn’t very obvious though what the bottleneck was since the streaming system load was quite low, around 0.6-1.0 in a 4 vCPU VM and it also had a virtio-net/gigabit[1] network card. Theoretically it should be able to push at least 100-150 more Mbps. In order to cope with the increasing demand we changed the player web page in order to off-load some users to an experimental service that relies on IP multicast from the server and P2P between the clients for delivering streams. This bought us some time, about 2-3 hours. Also maybe because it was noon time, or due to more people using the experimental service or not being satisfied from the performance of the streaming video and disconnecting, traffic later on dropped “down” to an average of 650-700Mbits.

We started discussing short-term actions for improving the service so as to be able to cope with more demand. The streaming server was running on GRNET’s virtualization platform, which is based on ganeti, and the first thought we had was to try and add more network cards to the VM and somehow bond the cards together. Could we push more than 1Gbps from the same VM? The problem was that we couldn’t do any 802.3ad bonding since the “virtual switch” inside the virtualization platform did not support such features. One other solution would be to add another virtual network card and use Linux bonding mode 5 (balance-tlb) or 6 (balance-alb). After a bit of reading this mode was rejected as well. These two bonding modes expect from the ethernet card running on the machine to support ethtool to read their speed. Our VMs use virtio-net which doesn’t support this functionality for ethtool. We could switch to another type of network card, e1000 for example, but this could have an unmeasured/untested performance penalty which could actually negate the addition of a second network card.

Hundreds of thousands of Greeks were planning to join this huge protest starting at 17:00 and so were some of us working at GRNET, at least I was. We had to make a decision though, drop our plans and improve the streaming service to help more people, especially Greeks living abroad, to access the stream or just join others at Syntagma square? Our shift was ending soon anyway. We decided to stay at work and try and improve the service as far as we could.

The path we chose in order to “scale” was to create to a second instance of the streamer and try to “balance” client requests to both streamers using round robin DNS. That involved creating a checkpoint of the running VM at our storage system, copy the running VM’s image from that checkpoint as a new image and run a new VM with that image. So we would be cloning the current streaming service while the service was running and serving clients (take that Windows!).

So we provisioned a new Debian server through LDAP, added the copied image disks at the VM’s configuration, booted the VM, run puppet to change the configuration files according to the new hostname and IP, and we were ready to serve more clients. After some testing we created a RR DNS entry, “streamer-frontend.domain.gr” which pointed to both first-streamer.domain.gr and second-streamer.domain.gr and had a TTL of 60. Changing the landing page though to serve streamer-frontend.domain.gr as the streamer url wasn’t enough. The first problem was that there were news sites and blogs that had copied directly our first streamer’s URL instead of the live.grnet.gr/paliament/ landing page, which actually runs on a different system and is served by an Apache2 server (more on that later). Having already more than 1000 streams on the first streamer and then starting to do RR DNS on both servers meant that there would still be a large number of clients served by the first server and new people getting directed there would only make matters worse, while people directed to the second server would have a much better service experience. So what we actually did was point streamer-frontend.domain.gr not on both first-streamer.domain.gr and second-streamer.domain.gr but just second-streamer.domain.gr. We also changed the IP address of first-streamer A,AAAA records to second-streamer’s IP and flushed the first-streamer RR at our caching resolvers. Since many people use our caching resolvers, especially students with DSL lines, we were able to direct even more people towards the second-streamer.

Before adding second-streamer.domain.gr:

* first-streamer.domain.gr -> 1.2.3.4 TTL 86400
* live.grnet.gr/parliament/ pointing the streamer URL at first-streamer.domain.gr

After adding second-streamer.domain.gr:

* streamer-frontend.domain.gr -> 1.2.3.5 TTL 60
* first-streamer.domain.gr -> 1.2.3.5 TTL 60
* second-streamer.domain.gr -> 1.2.3.5 TTL 60
* live.grnet.gr/parliament/ pointing the streamer URL at streamer-frontend.domain.gr

That way people disconnecting from the stream and reconnecting some time later on were pointed to the new server, if they used our landing page. That meant better quality streaming for both “old” clients getting their stream from first-streamer, and for the new clients that were being served from second-streamer.

Within 30 minutes since booting up, the second streamer was serving more than 250Mbps and after another 30′ its traffic had climbed up to 450Mbps while first-streamer was steadily serving more than 550Mbits. That lead us to an all time record of 1.02Gbps at 17:45. At that point we were serving more than 2000 concurrent streams. A number we never expected for this humble streaming service.

While traffic was increasing through the addition of the second streamer, another problem came up. Some misconfigured clients and HTTP proxies were opening up connections at the Apache 2 serving the web page and never closed them down. We hit Apache’s internal ServerLimit variable of 256 around 17:00. We had to increase ServerLimit inside Apache’s config and restart it:

ServerLimit 500
<IfModule mpm_prefork_module>
    StartServers         10 
    MinSpareServers      15 
    MaxSpareServers      25 
    MaxClients          500
    MaxRequestsPerChild   0  
</IfModule>

After some minutes of happiness another “unexpected” issue came up. It started to rain in Athens, so people who were at the protest at Syntagma square would probably leave soon and go home. There would certainly be an increase in traffic. And what about midnight, which is when the MPs were supposed to vote on the new measures? People would be sitting at their computers, bashing the politicians on Twitter and Facebook while watching the Parliament’s stream. At the same time we started seeing a big increase in international traffic, since more Greeks living abroad were tuning in; this stream was probably the only way they could watch what was happening at the Parliament.

That only meant one thing. Hello third-streamer! 10′ later we had another streamer running. But we also wanted to make some changes to the first two VMs. We wanted to add more vCPUs, going from 4 to 8, add more RAM, going from 4096Mb to 6144Mb, and do some minor performance tuning on the software. That meant restarting the VMs in order to activate the additional resources… luckily the chairman of the Parliament announced a 10 minute recess some time around 19:30. That was our chance… we changed back first-streamer’s IP address, added it to streamer-frontend RR DNS while also adding third-streamer to it. Then we rebooted the first two VMs. After 30″ we had 3 streamers running and waiting for clients to join them. third-streamer instantly got more than 200Mbps at the very moment we rebooted the other 2 VMs.

After adding third-streamer.domain.gr:

* streamer-frontend.domain.gr -> {1.2.3.4 | 1.2.3.5 | 1.2.3.6} TTL 60
* first-streamer.domain.gr -> 1.2.3.4 TTL 60
* second-streamer.domain.gr -> 1.2.3.5 TTL 60
* third-streamer.domain.gr -> 1.2.3.6 TTL 60
* live.grnet.gr/parliament/ pointing the streamer URL at streamer-frontend.domain.gr

At 20:10, some of us decided to leave work after 11 hours, having 3 streamers running that had already reached 1.2Gbps of traffic. There were more than 2800 concurrent users at the time…

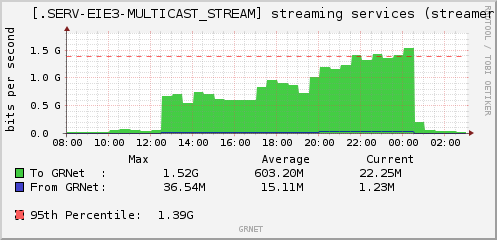
Our assumptions for midnight came true. Around that time, more than 4000 people had tuned in to the parliament’s stream and we were pushing about 1.66 Gbps. That was probably the all-time record for a single service in GRNET.

A big problem we didn’t solve that night
Unfortunately, each client gets a unique session id from the streamer, also when requesting an HTTP stream. These are not shared among the streamers, so if you send a subsequent HTTP request to a different streamer, who does not track that session id, it will not serve the request as expected but rather prompt the client to start a new session. Since some browsers did not cache the RRs of streamer-frontend long enough (remember that low TTL?) they would spread their requests to all the streamers. We knew this was happening but there was no way to solve this without extensive changes to the setup, which would have to be tested of course would mean significant downtime for the service. Therefore, depending on the browser people used, some got better or worse service than others. The good thing is that we know how to fix this in the future.

Some Stats & Graphs
more than 31000 unique IPs connecting to the streaming service
more than 4000 concurrent users at peak time
more than 4.7 TB of data streamed

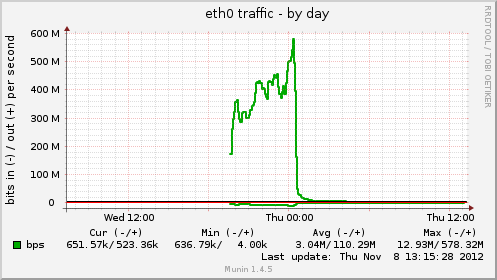
first-streamer ethernet traffic:

second-streamer ethernet traffic:

third-streamer ethernet traffic:

Streamer client types

Streamer LAN traffic aggregates:

Create your own graphs here: http://mon.grnet.gr/rg/157184/details/

Epilogue
Yeah, there were hiccups in the stream for many many people, we acknowledge that. But we certainly did the best we could to keep the service running. Could we have done better ? Yes we could, but we would have to re-design the service and make some drastic changes that were never tested before. We didn’t want to risk making drastic changes that might not work at all while we could somewhat “scale” our service using a “working” solution. I wonder what will happen on Sunday when the Parliament votes for 2013 budget…Will we exceed our previous peak? We’ve already discussed alternatives to cope with the extra traffic and we’ll definitely be better prepared [2]!

I think that zmousm, alexandros and me did a fairly good job regarding the circumstances. We should buy each other a beer sometime..We’ll treat faidonl another one though for his helpful consulting 🙂

Since no external CDNs or other services provided by companies abroad were used, this might be the event with the biggest ever demand in network resources served from within Greece.

Do you like solving such problems ? Then there might be a lurking sysadmin inside you 😉

[1] After a talk with apoikos, he corrected me saying that virtio-net does not have a “gigabit” capacity. Virtio-net’s capacity is only limited by the node resources available, so it can theoretically perform better than gigabit. So our thoughts on using balance-alb/tlb to cope with the extra bandwidth were wrong. This clue points out that the cause of bottleneck on the streamer that couldn’t go over 800Mbps was the streamer software itself since both VM’s and hardware node’s system load were low.

[2] On 11/11/2012 the Greek Parliament voted for 2013 budget. What we did prior to that day to cope with the traffic was to setup a new version of the streamer software, that actually came out on 08/11/2012 just one day after the initial spike, that had the option to disable session IDs. Then it was quite straightforward to add some varnish caches in front of the streamers to serve the HTTP streams to the clients. Unfortunately client demand was somewhat lower, it only reached 0.92Gbps.

When in doubt, always blame the application

When you have a misbehaving system and you are not sure what the problem is, always bet on a poorly written application.

Here’s a small example of how another poorly written web application caused system issues.

I was sitting at my office today I when I got this nagios alert for a host.

Date/Time: Tue Nov 6 19:15:11 EET 2012
Additional Info:
SWAP CRITICAL – 0% free (0 MB out of 509 MB)

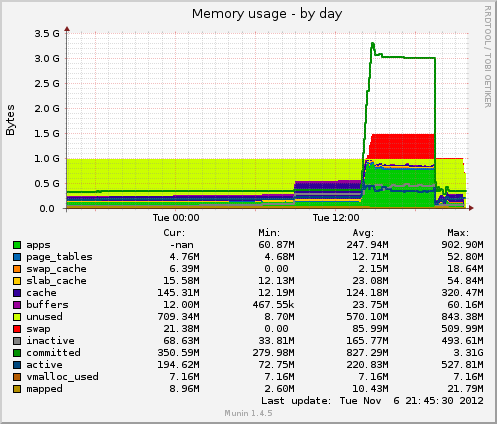
Logging in actually showed all the swap’s been used and so was RAM, 0.95/1Gb. Lots of apache2 server instances were running. I did a netstat and I saw a lot of ESTABLISHED connections:

tcp6       0      0 2001:DB8:f00::1:35571 2001:DB8:bar::100:80 ESTABLISHED 9631/apache2    
tcp6       0      0 2001:DB8:f00::1:35777 2001:DB8:bar::100:80 ESTABLISHED 9656/apache2    
tcp6       0      0 2001:DB8:f00::1:36531 2001:DB8:bar::100:80 ESTABLISHED 11578/apache2   
tcp6       0      0 2001:DB8:f00::1:36481 2001:DB8:bar::100:80 ESTABLISHED 11158/apache2   
tcp6       0      0 2001:DB8:f00::1:36295 2001:DB8:bar::100:80 ESTABLISHED 11115/apache2   
tcp6       0      0 2001:DB8:f00::1:34831 2001:DB8:bar::100:80 ESTABLISHED 8312/apache2  

2001:DB8:f00::1 -> my server
2001:DB8:bar::100 -> dst server

As one can easily see my server is connecting to port 80 of dst, possibly asking for something over HTTP.

# netstat -antpW | grep 2001:DB8:bar::100 | wc -l
111

# dig -x 2001:DB8:bar::100 +short                                 
crl.randomcertauthority.com.

tailing the log files didn’t show anything weird happening. I run a tcpdump for that dst server but there wasn’t at that time any traffic going on.

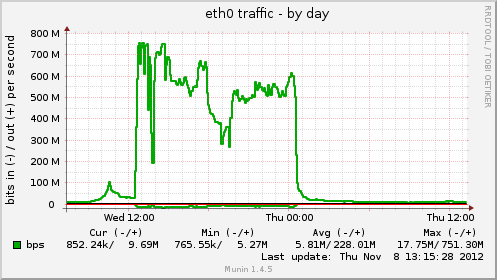
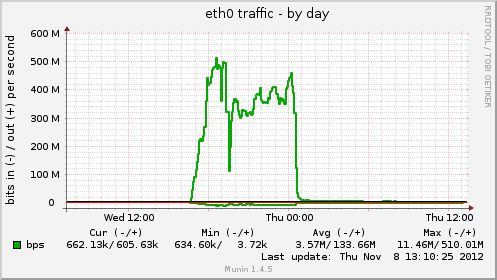
So, I took a look at munin to see when this problem started developing.


As it’s obvious from the above graphs, the problem started around 14:00. So I took another look at the apache logs and I saw a bot crawling a specific url from my server. I visited that url on my server using curl and I saw traffic flowing through tcpdump going from my server to dst server. So visiting that URL was definitely causing problems. But why?

I restarted apache, swap and memory were released, all the stale ESTABLISHED connections went away and I saw hundreds of FIN/RST packets going back and forth at tcpdump.

I tried to open a few concurrent connections from my PC to my server’s url using curl. After a couple of tries netstat showed that I had managed to create stale ESTABLISHED connections towards dst server. It was an HTTP connection asking for a crl. So I was both able to reproduce the problem and I also knew the specific url of the dst server that caused the connection hanging issues.
Next thing I did was to try to open direct HTTP connections from my server to the dst url using curl. After a few concurrent connections I managed to make curl hang. So the problem was definitely not on my server, but at the dst server.

Since it was already quite late, my first (re)action was to install mod_evasive to try and minimize the problem so I could take a better look the next day.

# aptitude install libapache2-mod-evasive
# a2enmod mod_evasive
### edit /etc/apache2/sites-enabled/site-name and add the following
       <IfModule mod_evasive20.c>
            DOSHashTableSize    3097
            DOSPageCount        1   
            DOSSiteCount        50  
            DOSPageInterval     1   
            DOSSiteInterval     1   
            DOSBlockingPeriod   10  
            DOSEmailNotify myemail@mydomain.gr
        </IfModule>
# /etc/init.d/apache2 reload

I tried to curl my server’s URL from my PC and I got blocked after the second concurrent try. But after some repetitions I was still able to create one or two stale ESTABLISHED connections from my server to the dst server. Far fewer than before but the problem was still somewhat reproducible.

Then I decided to take a look at the site’s PHP code. Finding the culprit was quite easy, I just had to find the code segment where PHP requested the dst server’s url.
Here’s the code segment:

$ch = curl_init($this->crl_url);
curl_setopt($ch, CURLOPT_RETURNTRANSFER,true);
$crl_content = curl_exec($ch);

The developer had never thought that the remove server might keep the connection open for whatever reason (rate limiting anyone?)

Patching it was quite simple:

$ch = curl_init($this->crl_url);
curl_setopt($ch, CURLOPT_RETURNTRANSFER,true);
curl_setopt($ch, CURLOPT_CONNECTTIMEOUT,'60');
curl_setopt($ch, CURLOPT_TIMEOUT,'60');
$crl_content = curl_exec($ch);

After this everything worked fine again. Connections were getting ESTABLISHED but after 60 seconds they got torn down, automagically. No more stale ESTABLISHED connections. Hooray!

A letter to every developer:

Dear developer,

please test your code before shipping. Pretty please take corner cases into account. We know you’re competent enough, don’t be lazy.

Your kind sysadmin

Bypassing censorship devices by obfuscating your traffic using obfsproxy

*WARNING* 14/01/2014 This post is quite deprecated. For example obfsproxy has been completely rewritten in python and there is a newer and more secure replacement of obfs2, named obfs3. Please read this obfsproxy-debian-instructions for any updates.

Some countries like China, Iran, Ethiopia, Kazakhstan and others, like installing some nasty little boxes at the edges of their country’s “internet feed” to monitor and filter traffic. These little boxes are called DPI (Deep Packet Inspection) boxes and what they do, is sniff out every little packet flowing through them to find specific patterns and then they provide their administrator with the option to block traffic that matches these patterns. These boxes are very sophisticated and they don’t just filter traffic by src, dst or port, they filter traffic by the content (payload) the packets carry.
Unfortunately, it’s not just these countries that deploy DPI technologies, but some private companies also use such devices in order to monitor their employees.

The 10 thousand feet view
Tor is a nice way to avoid basic censorship technologies, but sometimes DPI technology is so good that it can fingerprint Tor traffic, which is already encrypted, and block it. In response to that, Tor people devised a technology called Pluggable Transports whose job is to obfuscate traffic in various ways so that it looks like something different than it actually is. For example it can make Tor traffic look like a skype call using SkypeMorph or one can use Obfsproxy to obfuscate traffic to look like…nothing, or at least nothing easily recognizable. What’s cool about obfsproxy though is that one can even use it separately from Tor, to obfuscate any connection he needs to.

A warning
Even though obfsproxy encrypts traffic and makes it look completely random, it’s not a fool proof solution for everything. It’s basic job is to defend against DPI that can recognize/fingerprint TLS connections. If someone has the resources he could potentially train his DPI box to “speak” the obfsproxy protocol and eventually decrypt the obfuscated traffic. What this means is that obfsproxy should not be used as a single means of protection and it should just be used as a wrapper _around_ already encrypted SSL traffic.
If you’re still in doubt about what can obfsproxy protect you from and from what it can’t, please read the Obfsproxy Threat Model document.

Two use cases
Obfuscate an SSH and an OpenVPN connection.
Obviously one needs a server outside the censorship perimeter that he or someone else will run the obfsproxy server part. Instructions on installing obfsproxy on Debian/Ubuntu are given in my previous blog post setting up tor + obfsproxy + brdgrd to fight censhorship. Installing netcat, the openbsd version; package name is netcat-openbsd on Debian/Ubuntu, is also needed for the SSH example.

What both examples do is obfuscate a TLS connection through an obfsproxy server so that it looks innocent. Assuming that the most innocent looking traffic is HTTP, try running the obfsproxy server part on port 80.

SSH connection
Scenario:
USER: running ssh client
HOST_A (obfsproxy): running obfsproxy on port 80 and redirecting to HOST_B port 22
HOST_B (dst): Running SSH server on port 22

What one needs to do is setup the following “tunneling”:
ssh client —> [NC SOCKS PROXY] —> obfsproxy client (USER)—> obfsproxy server (HOST_A) —> ssh server (HOST_B)

Steps:
1. on HOST_A setup obfsproxy server to listen for connection and redirect to HOST_B:
# screen obfsproxy --log-min-severity=info obfs2 --dest=HOST_B:22 server 0.0.0.0:80

2. on USER’s box, then configure obfsproxy client to setup a local socks proxy that will obfuscate all traffic passing through it:
$ screen obfsproxy --log-min-severity=info obfs2 socks 127.0.0.1:9999
Then instead of SSH-ing directly to HOST_B, the user has to ssh to HOST_A port 80 (where obfsproxy server is listening).

3. on USER’s box again, edit ~/.ssh/config and add something along the following lines:

Host HOST_A
    ProxyCommand /bin/nc.openbsd -x 127.0.0.1:9999 %h %p

This will force all SSH connections to HOST_A to pass through the local (obfsproxy) socks server listening on 127.0.0.1:9999

4. Finally run the ssh command:
$ ssh -p 80 username@HOST_A

That’s it. The connection will now pass get obfuscated locally, pass through obfsproxy server at HOST_A and then finally reach it’s destination at HOST_B.

OpenVPN connection
Scenario:
USER: running OpenVPN client
HOST_A (obfsproxy): running obfsproxy on port 80 and redirecting to HOST_B TCP port 443
HOST_B (dst): Running OpenVPN server on port 443

What one needs to do is setup the following “tunneling”:
openvpn client —> obfsproxy client (USER)—> obfsproxy server (HOST_A) —> OpenVPN server (HOST_B)

Steps:
1. on HOST_A setup obfsproxy server to listen for connection and redirect to HOST_B:
# screen obfsproxy --log-min-severity=info obfs2 --dest=HOST_B:443 server 0.0.0.0:80

2. on USER’s box, then configure obfsproxy client to setup a local socks proxy that will obfuscate all traffic passing through it:
$ screen obfsproxy --log-min-severity=info obfs2 socks 127.0.0.1:9999
Then instead of connecting the OpenVPN client directly to HOST_B, the user has edit OpenVPN config file to connect to HOST_A port 80 (where obfsproxy server is listening).

3. on USER’s box again, edit your openvpn config file, change the ‘port’ and ‘remote’ lines and add a ‘socks-proxy’ one:

port 80
remote HOST_A
socks-proxy 127.0.0.1 9999

This will instruct the OpenVPN client to connect to HOST_A passing through the local (obfsproxy) socks server listening on 127.0.0.1:9999

4. Finally run the openvpn client command:
$ openvpn client.config

That’s it.

Security Enhancement
You can “enhance” obfproxy’s security by adding a shared secret parameter to command line, so anyone who doesn’t have this secret key won’t be able to use the obfsproxy server, decryption of packets will fail:
# screen obfsproxy --log-min-severity=info obfs2 --shared-secret="foobarfoo" --dest=HOST_B:443 server 0.0.0.0:80
$ screen obfsproxy --log-min-severity=info obfs2 --shared-secret="foobarfoo" socks 127.0.0.1:9999

Documentation
Or at least…some documentation.

Your best chance to understand the internals of obfsproxy is to read the protocol specification

For more info about obfsproxy client part, read the documentation here: obfsproxy client external
For more info about obfsproxy server part, read the documentation here: obfsproxy server external

Screenshots
For those who like meaningless screenshots, here’s what wireshark (which is certainly NOT a DPI) can tell about a connection without and with obfsproxy:

Without obfsproxy

With obfsproxy

*Update*
one can find openvpn configuration files for use with obfsproxy here:
Linux Client
Windows Client

setting up tor + obfsproxy + brdgrd to fight censhorship

*WARNING* 14/01/2014 This post is quite deprecated. For example obfsproxy has been completely rewritten in python and there is a newer and more secure replacement of obfs2, named obfs3. Please read this obfsproxy-debian-instructions for any updates.

*Updated* look at the bottom for list of changes

This post is a simple guide to create a debian/ubuntu packages out of the latest versions of Tor, obfsproxy and brdgrd in order to setup a “special gateway” and help people who face censorship issues. Sharing some of your bandwidth helps a lot of people get back their freedom.

Tor
I guess most people already know what Tor is, quoting from Tor’s website:

Tor is a network of virtual tunnels that allows people and groups to improve their privacy and security on the Internet. It also enables software developers to create new communication tools with built-in privacy features. Tor provides the foundation for a range of applications that allow organizations and individuals to share information over public networks without compromising their privacy.

obfsproxy

obfsproxy is a tool that attempts to circumvent censorship, by transforming the Tor traffic between the client and the bridge. This way, censors, who usually monitor traffic between the client and the bridge, will see innocent-looking transformed traffic instead of the actual Tor traffic.

brdgrd

brdgrd is short for “bridge guard”: A program which is meant to protect Tor bridges from being scanned (and as a result blocked) by the Great Firewall of China.

Combining these to work together is quite easy if you follow this simple guide/howto.


////// Become root
$ sudo su -

////// Get build tools/packages
# cd /usr/src/
# apt-get install build-essential libssl-dev devscripts git-core autoconf debhelper autotools-dev libevent-dev dpatch pkg-config
# apt-get install hardening-includes asciidoc docbook-xml docbook-xsl xmlto
# apt-get install screen libnetfilter-queue-dev

////// Get latest versions of tor/obfsproxy/brdgrd
# git clone https://git.torproject.org/debian/obfsproxy.git
# git clone https://git.torproject.org/debian/tor.git
# git clone https://git.torproject.org/brdgrd.git

////// Compile obfsproxy & create package
# cd obfsproxy/
# ./autogen.sh 
# debuild -uc -us 

////// Compile tor & create package
# cd ../tor/
# ./autogen.sh 
# debuild -uc -us 

////// Install packages
////// The following package versions might be different depending on your configuration. Change them appropriately by looking at the deb files in your path: ls *.deb

# cd ..
# dpkg -i tor-geoipdb_0.2.4.3-alpha-1_all.deb obfsproxy_0.1.4-2_amd64.deb tor_0.2.4.3-alpha-1_amd64.deb

////// Create Tor configuration
////// PLEASE SEE THE CHANGEME_X VARIABLE BELOW BEFORE RUNNING THE FOLLOWING COMMAND

# cat > /etc/tor/torrc << EOF 
AvoidDiskWrites 1
DataDirectory /var/lib/tor
ServerTransportPlugin obfs2 exec /usr/bin/obfsproxy --managed
Log notice file /var/log/tor/notices.log
## If you want to enable management port uncomment the following 2 lines and add a password
## ControlPort 9051
## HashedControlPassword 16:CHANGEME
## CHANGEME_1 -> provide a nickname for your bridge, can be anything you like.
Nickname CHANGEME_1
## CHANGEME_2 -> How many KB/sec will you share. Don't be stingy! Try putting _at least_ 20 KB.
RelayBandwidthRate CHANGEME_2 KB
## CHANGEME_3 -> Put a slightly higher value than your previous one. e.g if you put 500 on CHANGEME_2, put 550 on CHANGEME_3.
RelayBandwidthBurst CHANGEME_3 KB
ExitPolicy reject *:* 
## CHANGEME_4 -> If you want others to be able to contact you uncomment this line and put your GPG fingerprint for example.
#ContactInfo CHANGEME_4
ORPort 443 
#ORPort [2001:db8:1234:5678:9012:3456:7890:1234]:443
BridgeRelay 1
## CHANGEME_5 -> If you don't want to publish your bridge in BridgeDB, so you can privately share it with your friends uncomment the following line
#PublishServerDescriptor 0
EOF

////// Restart Tor

# /etc/init.d/tor restart

////// Compile and run brdgrd
////// If you've changed ORport in Tor config above, be sure to change the "--sport 443" port below as well
////// brdgrd does not help since obfsproxy is already running in front of the bridge, but won't hurt either.

# cd brdgrd/
# make
# iptables -A OUTPUT -p tcp --tcp-flags SYN,ACK SYN,ACK --sport 443 -j NFQUEUE --queue-num 0
////// brdgrd Can't do IPv6 yet...so the next line is commented out
////// ip6tables -A OUTPUT -p tcp --tcp-flags SYN,ACK SYN,ACK --sport 443 -j NFQUEUE --queue-num 0
////// You can run brdgrd without root, just by setting some correct cap_net_admin rights
////// Instead of: screen -dmS brdgrd ./brdgrd -v
$ sudo screen -dmS brdgrd setcap cap_net_admin=ep ./brdgrd -v

# tail -f /var/log/tor/notices.log

The above guide has been tested on Debian Squeeze and Ubuntu 12.04.

That’s it. You just made the world a better place.

*Update*
I’ve made some changes to the post according to comments on the blog post and #tor-dev.
a) Changed URLs for the git clone operations to https:// instead of git://
b) Changed brdgrd git url to gitweb.torproject.org instead of github.
c) Changed config sections of torrc file
d) Added some more info on brdgrd

*Update2*
Tor has published “official” instructions for setting up obfsproxy bridges on Debian boxes –> Setting up an Obfsproxy Bridge on Debian/Ubuntu

*Update3*
Update sample config to inform about unpublished bridges.

*Experimental* Chrome extension containing Greek HTTPS-Everywhere rules

I’ve just uploaded an experimental version of HTTPS-Everywhere Google Chrome extension containing Greek rules.

You can find it on https-everywhere-greek-rules downloads page on github.

To install it, download the .crx from github, open Extensions Settings and drag the downloaded .crx on the Extensions page. It will prompt you to install it.

After installation you can visit www.void.gr or www.nbg.gr to test it. You should be seeing a new icon on the left of the url bar to notify you that HTTPS-Everywhere applied some rules.

I’ve tested it on Google Chrome Version 21 on Linux and it seems to work ok. If you have any problems open up an issue on github.

Happy safer surfing…

Bind9 statistics-channels munin plugin

Bind9, since version 9.5, offers an experimental embedded web server which can provide statistics abound Bind through HTTP. Upon enabling, one can access this web server and get an XML response full with various statistics.

Enabling the feature is quite easy. One just needs to add some lines like the following inside Bind’s configuration file:

statistics-channels {
          inet 127.0.0.1 port 8053 allow {127.0.0.1;};
};

Restart Bind and try connecting to the statistics-channel. For example through curl:

$ curl http://127.0.0.1:8053
<?xml version="1.0" encoding="UTF-8"?>
<?xml-stylesheet type="text/xsl" href="/bind9.xsl"?>
<isc version="1.0">
  <bind>
    <statistics version="2.2">
      <views>
        <view>
          <name>_default</name>
          <zones>
            <zone>
              <name>0.in-addr.arpa/IN</name>
              <rdataclass>IN</rdataclass>
              <serial>1</serial>
            </zone>
            <zone>
              <name>10.in-addr.arpa/IN</name>
              <rdataclass>IN</rdataclass>
              <serial>1</serial>
            </zone>
...
...
...
...
         <TotalUse>810834110</TotalUse>
          <InUse>327646360</InUse>
          <BlockSize>740556800</BlockSize>
          <ContextSize>9954232</ContextSize>
          <Lost>0</Lost>
        </summary>
      </memory>
    </statistics>
  </bind>
</isc>

The output will be quite big, for example the current output from a busy recursive resolver is around 2.5Mb.

People usually use munin to monitor bind through 2 different ways. The first, usually applied to servers that are not very busy, for example servers with less than 100queries/sec, is to parse the output of the query log. Then a munin plugin that comes with the default munin installation and is called bind9 can parse the query log and create some graphs. The second way for a bit busier servers is to have query log disabled and monitor bind is through the output of the rndc stats command. A munin plugin that also comes with the default munin package and is called bind9_rndc can parse the created named.stats output file and create some nice graphs. To configure either of the two ways one can take a look at this informational wiki: http://wiki.debuntu.org/wiki/Munin/Bind9_Plugin

A third way is to have a new munin plugin get the XML output from the statistics-channel described above and create some even fancier and richer graphs. Luckily a guy called Andrew Duquette has created such a perl plugin for munin. You need to exercise your google skills to find it though, (that is if you don’t cheat searching with his name as a search term!) I took that plugin, made some changes to it and uploaded it to github. The plugin is called bind9_statchannel and you can find it in my github munin-plugins repo.

The changes I made were the following:

  • Use STACK instead of just AREA for some graphs
  • Add warning and critical levels for type ANY queries (to warn for DDoS through such queries)
  • Raise timeout to 300 seconds
  • Add sorting to stacked graphs so they are a bit more readable/comparable

The plugin creates the following type of graphs:

  • Cache DB RRsets for various views (or the _default if you don’t have any others)
  • Memory Context “In Use”
  • Memory Usage Summary
  • Queries In
  • Queries Out
  • Resolver Statistics for various views (or the _default if you don’t have any others)
  • Server Statistics
  • Socket I/O Statistics
  • Tasks

As you can see it can give many more details compared to the other bind9 munin plugins. It’s also the only bind9 munin plugin that can tell you how many incoming vs outgoing queries there are, as well as the only one that can tell you how many queries you have over IPv4 vs IPv6.

To use it on Debian you need to at least install the following two perl packages: libxml-simple-perl, liblwp-useragent-determined-perl

Here are some sample graphs from the bind9_statchannel plugin:

If you have any bug fixes, code changes, etc please don’t hesitate to fork and open a pull request on github.

Download: bind9_statchannel

Greek rules for HTTPS Everywhere

HTTPS Everywhere is a browser addon by EFF whose job is to redirect you to the HTTPS versions of certain, whitelisted, web sites. What this means is that HTTPS Everywhere protects your communication with those websites by forcing them to be encrypted.

The current HTTPS Everywhere ruleset lacks any Greek websites, so I started yet-another-list to create rules for Greek websites. This is the fourth list I’m maintaing after GrRBL, Greek Spammers Blacklist and Greek AdblockPlus Filter rules and it is the only one where being included is actually a good thing.

You can find some more info about Greek rules for HTTPS Everywhere on my github page.

Until the rules get adopted upstream by HTTPS Everywhere team, in order to use them you should download the rules and place them inside your Firefox profile directory. But first of all you need to install the plugin/extension/addon/call-me-whatever-you-want by going to HTTPS Everywhere page.

Step 1: Instructions for Linux users
Go to the HTTPSEverywhereUserRules directory inside your firefox profile directory:

$ cd .mozilla/firefox/XYZXYZXYZ.default/HTTPSEverywhereUserRules/
(XYZXYZXYZ will be different in your machine)

and download the current Greek ruleset:
$ wget https://raw.github.com/kargig/https-everywhere-greek-rules/master/Greek.xml

Step 1: Instructions for Windows users
Download https://raw.github.com/kargig/https-everywhere-greek-rules/master/Greek.xml with your favorite browser.
Then, according to this Mozilla support page, open Fifefox, go to Help->Troubleshooting Information and under the Application Basics section, click on Open Containing Folder. There a window will appear and you should copy the previously downloaded Greek.xml file inside the HTTPSEverywhereUserRules folder.

Step 2: Instructions for any OS
Either restart your browser to load the new rules or click the HTTPS Everywhere icon beside the url bar, select “Disable HTTPS Everywhere”, then click it again and select “Enable HTTPS Everywhere”. The new rules should now be loaded, you can test by going to http://void.gr and it should immediately redirect you to https://void.gr

Some notes
The ruleset is experimental. If you find any problems please report them as issues to github.
If you want a Greek website added to the list, either report it as a new issue on github or fork the repository, add your own rules and open a pull request.

A small rant
I found some webmails in Greece that don’t even offer HTTPS as an option to the user. They ‘POST’ user details, including passwords of course, over unencrypted HTTP connections. I will be updating a text file called hallofshame.txt inside the github reposity of Greek rules for HTTPS Everywhere with such websites. I am planning to inform the operators of such websites every now and then, so if you know any other cases please open up new issues so we can help protect innocent users.

A big rant on current HTTPS status of top Greek websites
The status of HTTPS support on top 100 Greek websites (according to Alexa) is SAD. No wait, it is EXTEMELY SAD. Out of these 100 websites, taking into account only the ones that are actually run by Greeks, that means excluding Google, Facebook, Youtube, LinkedIn, etc, only 2, yes you read correctly, just two websites offer HTTPS support.
The reason 95% the others don’t is probably because they are based on Akamai-zed services and either don’t have the money to buy Akamai’s HTTPS products or don’t have the technical skills to do it properly.

If you don’t run an Akamai-zed website and want a completely free 1-year SSL certificate please visit https://www.startssl.com/. If you need professional help with your setup please don’t hesitate to contact.

There’s a very good (financial) explanation why these high traffic Greek sites have prefered Akamai’s services and haven’t deployed their own servers in Greece but this will be the content of another blog post coming soon.

itop – Interrupts ‘top-like’ utility for Linux

On a 24-core Linux machine I wanted to monitor interrupts/sec. The reason is quite complicated, let’s say that there are more than 100.000 interrupts/sec and I want to monitor who needs what.

First I installed Debian’s itop package. It didn’t work at all on the 24-core machine, just showed an empty display. Then I tried a perl itop implementation I found online at a redhat server, let’s call it redhat’s itop. That still didn’t work well. Lot’s of parsing issues and it certainly wasn’t ready to deal with 24-cores.

So I tweaked it a bit and made it ready for a 24-core server. You can find it online at my github repository: kargig’s itop

Since displaying 24 columns of continuously changing numbers doesn’t fit all screens, I added some command line options to the tool.
By default it shows all interrupts/sec per CPU if the number of CPU cores is not higher than 8. If it’s higher than 8 it just displays the total (adding all per core numbers) interrupts/sec.
Command line flag ‘-a’ forces displaying of ALL cores and command line flag ‘-t’ forces displaying just the TOTAL number of interrupts/sec.

So if you too need to monitor your server’s interrupts/sec, give my itop a try. If you want to make changes, just fork it on github. Simple as that…I promise to merge any interesting changes/pull requests you people send me!

oh and here’s a screenshot of ‘itop -t’

AthCon 2012 – Are you ready for IPv6 insecurities ?

My presentation for AthCon 2012 is now available online: Are you ready for IPv6 insecurities ?